2018 House Election Interactive Map
All 435 House seats to be contested in 2018
The biennial election for representatives from all 435 Congressional Districts will take place on November 6, 2018. Winners will be sworn in to serve in the 116th Congress in early January, 2019. The Republican Party currently controls the U.S. House, where 218 seats are needed for control (when there are no vacancies).
Use the interactive maps to create your own 2018 House election forecast. Pro ratings are derived from the final 2018 consensus forecast. Use Who Represents Me to look-up elected officials – including contact info – for any address in the country.
House Elections 2018
| Current | 197 | 236 | 0 | 2* |
| Pro | 210 | 197 | 0 | 28 |
| Forecast |
Pro: 2018 Consensus Forecast
Forecast: Totals on interactive map
* Vacant Seat(s)
| District | Incumbent | Party | Since | Term | Predictions | Margin of Victory | ||||||||||||||||||||||||||||||||||||||||||||||||||||||||||||||||||||||||||||||||||||||||||||
|---|---|---|---|---|---|---|---|---|---|---|---|---|---|---|---|---|---|---|---|---|---|---|---|---|---|---|---|---|---|---|---|---|---|---|---|---|---|---|---|---|---|---|---|---|---|---|---|---|---|---|---|---|---|---|---|---|---|---|---|---|---|---|---|---|---|---|---|---|---|---|---|---|---|---|---|---|---|---|---|---|---|---|---|---|---|---|---|---|---|---|---|---|---|---|---|---|---|---|
| Pro | Map | House(a) | President(b) | |||||||||||||||||||||||||||||||||||||||||||||||||||||||||||||||||||||||||||||||||||||||||||||||
| AK-AL |  |
Don Young | 1973 | 23rd |
|
14.3% | 15.2% | |||||||||||||||||||||||||||||||||||||||||||||||||||||||||||||||||||||||||||||||||||||||||||
| AR-2 |  |
French Hill | 2015 | 2nd |
|
21.5% | 10.7% | |||||||||||||||||||||||||||||||||||||||||||||||||||||||||||||||||||||||||||||||||||||||||||
| AZ-1 |  |
Tom O'Halleran | 2017 | 1st |
|
7.3% | 1.1% | |||||||||||||||||||||||||||||||||||||||||||||||||||||||||||||||||||||||||||||||||||||||||||
| AZ-2 |  |
Martha McSally | 2015 | 2nd |
|
13.9% | 4.9% | |||||||||||||||||||||||||||||||||||||||||||||||||||||||||||||||||||||||||||||||||||||||||||
|
Incumbent not running for re-election in 2018.
|
||||||||||||||||||||||||||||||||||||||||||||||||||||||||||||||||||||||||||||||||||||||||||||||||||
| AZ-6 |  |
David Schweikert | 2011 | 4th |
|
24.3% | 10.0% | |||||||||||||||||||||||||||||||||||||||||||||||||||||||||||||||||||||||||||||||||||||||||||
| AZ-8 |  |
Debbie Lesko | 2018 | 1st |
|
37.1% | 21.1% | |||||||||||||||||||||||||||||||||||||||||||||||||||||||||||||||||||||||||||||||||||||||||||
| CA-1 |  |
Doug LaMalfa | 2013 | 3rd |
|
18.1% | 19.7% | |||||||||||||||||||||||||||||||||||||||||||||||||||||||||||||||||||||||||||||||||||||||||||
| CA-4 |  |
Tom McClintock | 2009 | 5th |
|
25.4% | 14.7% | |||||||||||||||||||||||||||||||||||||||||||||||||||||||||||||||||||||||||||||||||||||||||||
| CA-7 |  |
Ami Bera | 2013 | 3rd |
|
2.3% | 11.4% | |||||||||||||||||||||||||||||||||||||||||||||||||||||||||||||||||||||||||||||||||||||||||||
| CA-10 |  |
Jeff Denham | 2011 | 4th |
|
3.4% | 3.0% | |||||||||||||||||||||||||||||||||||||||||||||||||||||||||||||||||||||||||||||||||||||||||||
| CA-16 |  |
Jim Costa | 2013 | 3rd |
|
16.1% | 21.6% | |||||||||||||||||||||||||||||||||||||||||||||||||||||||||||||||||||||||||||||||||||||||||||
| CA-21 |  |
David Valadao | 2013 | 3rd |
|
13.5% | 15.5% | |||||||||||||||||||||||||||||||||||||||||||||||||||||||||||||||||||||||||||||||||||||||||||
| CA-22 |  |
Devin Nunes | 2003 | 8th |
|
35.1% | 9.5% | |||||||||||||||||||||||||||||||||||||||||||||||||||||||||||||||||||||||||||||||||||||||||||
| CA-24 |  |
Salud Carbajal | 2017 | 1st |
|
6.8% | 20.2% | |||||||||||||||||||||||||||||||||||||||||||||||||||||||||||||||||||||||||||||||||||||||||||
| CA-25 |  |
Steve Knight | 2015 | 2nd |
|
6.3% | 6.7% | |||||||||||||||||||||||||||||||||||||||||||||||||||||||||||||||||||||||||||||||||||||||||||
| CA-39 |  |
Edward Royce | 1993 | 13th |
|
14.5% | 8.6% | |||||||||||||||||||||||||||||||||||||||||||||||||||||||||||||||||||||||||||||||||||||||||||
|
Incumbent not running for re-election in 2018.
|
||||||||||||||||||||||||||||||||||||||||||||||||||||||||||||||||||||||||||||||||||||||||||||||||||
| CA-45 |  |
Mimi Walters | 2015 | 2nd |
|
17.1% | 5.4% | |||||||||||||||||||||||||||||||||||||||||||||||||||||||||||||||||||||||||||||||||||||||||||
| CA-48 |  |
Dana Rohrabacher | 1989 | 15th |
|
16.6% | 1.7% | |||||||||||||||||||||||||||||||||||||||||||||||||||||||||||||||||||||||||||||||||||||||||||
| CA-49 |  |
Darrell Issa | 2001 | 9th |
|
0.5% | 7.5% | |||||||||||||||||||||||||||||||||||||||||||||||||||||||||||||||||||||||||||||||||||||||||||
|
Incumbent not running for re-election in 2018.
|
||||||||||||||||||||||||||||||||||||||||||||||||||||||||||||||||||||||||||||||||||||||||||||||||||
| CA-50 |  |
Duncan Hunter | 2009 | 5th |
|
26.9% | 15.0% | |||||||||||||||||||||||||||||||||||||||||||||||||||||||||||||||||||||||||||||||||||||||||||
| CO-3 |  |
Scott Tipton | 2011 | 4th |
|
14.3% | 12.0% | |||||||||||||||||||||||||||||||||||||||||||||||||||||||||||||||||||||||||||||||||||||||||||
| CO-6 |  |
Mike Coffman | 2009 | 5th |
|
8.3% | 8.9% | |||||||||||||||||||||||||||||||||||||||||||||||||||||||||||||||||||||||||||||||||||||||||||
| FL-6 |  |
OPEN |
|
17.1% | 17.0% | |||||||||||||||||||||||||||||||||||||||||||||||||||||||||||||||||||||||||||||||||||||||||||||
| FL-7 | 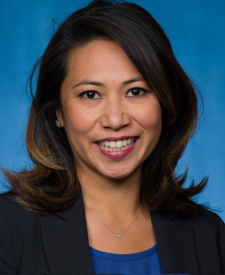 |
Stephanie Murphy | 2017 | 1st |
|
3.0% | 7.3% | |||||||||||||||||||||||||||||||||||||||||||||||||||||||||||||||||||||||||||||||||||||||||||
| FL-15 | 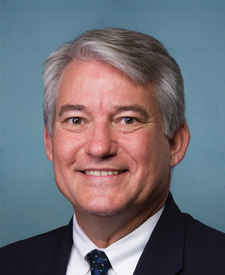 |
Dennis Ross | 2011 | 4th |
|
14.9% | 10.0% | |||||||||||||||||||||||||||||||||||||||||||||||||||||||||||||||||||||||||||||||||||||||||||
|
Incumbent not running for re-election in 2018.
|
||||||||||||||||||||||||||||||||||||||||||||||||||||||||||||||||||||||||||||||||||||||||||||||||||
| FL-16 | 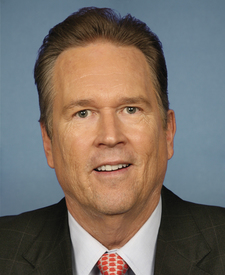 |
Vern Buchanan | 2007 | 6th |
|
19.5% | 10.7% | |||||||||||||||||||||||||||||||||||||||||||||||||||||||||||||||||||||||||||||||||||||||||||
| FL-18 | 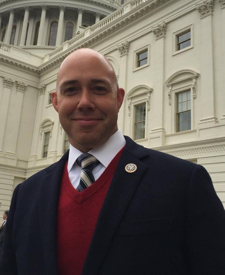 |
Brian Mast | 2017 | 1st |
|
10.5% | 9.2% | |||||||||||||||||||||||||||||||||||||||||||||||||||||||||||||||||||||||||||||||||||||||||||
| FL-25 | 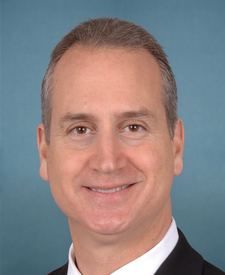 |
Mario Diaz-Balart | 2003 | 8th |
|
24.7% | 1.8% | |||||||||||||||||||||||||||||||||||||||||||||||||||||||||||||||||||||||||||||||||||||||||||
| FL-26 | 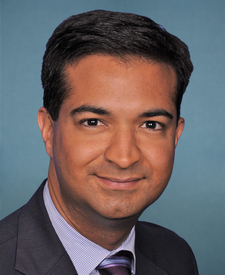 |
Carlos Curbelo | 2015 | 2nd |
|
11.8% | 16.3% | |||||||||||||||||||||||||||||||||||||||||||||||||||||||||||||||||||||||||||||||||||||||||||
| FL-27 | 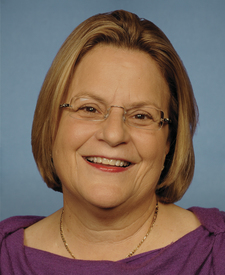 |
Ileana Ros-Lehtinen | 1989 | 15th |
|
9.8% | 19.6% | |||||||||||||||||||||||||||||||||||||||||||||||||||||||||||||||||||||||||||||||||||||||||||
|
Incumbent not running for re-election in 2018.
|
||||||||||||||||||||||||||||||||||||||||||||||||||||||||||||||||||||||||||||||||||||||||||||||||||
| GA-6 |  |
Karen Handel | 2017 | 1st |
|
23.4% | 1.5% | |||||||||||||||||||||||||||||||||||||||||||||||||||||||||||||||||||||||||||||||||||||||||||
| GA-7 |  |
Rob Woodall | 2011 | 4th |
|
20.8% | 6.3% | |||||||||||||||||||||||||||||||||||||||||||||||||||||||||||||||||||||||||||||||||||||||||||
| IA-1 |  |
Rod Blum | 2015 | 2nd |
|
7.7% | 3.5% | |||||||||||||||||||||||||||||||||||||||||||||||||||||||||||||||||||||||||||||||||||||||||||
| IA-3 |  |
David Young | 2015 | 2nd |
|
13.7% | 3.5% | |||||||||||||||||||||||||||||||||||||||||||||||||||||||||||||||||||||||||||||||||||||||||||
| IA-4 |  |
Steve King | 2003 | 8th |
|
22.6% | 27.4% | |||||||||||||||||||||||||||||||||||||||||||||||||||||||||||||||||||||||||||||||||||||||||||
| IL-6 | 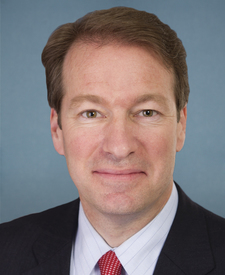 |
Peter Roskam | 2007 | 6th |
|
18.4% | 7.0% | |||||||||||||||||||||||||||||||||||||||||||||||||||||||||||||||||||||||||||||||||||||||||||
| IL-12 |  |
Mike Bost | 2015 | 2nd |
|
14.6% | 14.8% | |||||||||||||||||||||||||||||||||||||||||||||||||||||||||||||||||||||||||||||||||||||||||||
| IL-13 |  |
Rodney Davis | 2013 | 3rd |
|
19.3% | 5.5% | |||||||||||||||||||||||||||||||||||||||||||||||||||||||||||||||||||||||||||||||||||||||||||
| IL-14 |  |
Randy Hultgren | 2011 | 4th |
|
18.6% | 3.9% | |||||||||||||||||||||||||||||||||||||||||||||||||||||||||||||||||||||||||||||||||||||||||||
| IN-2 |  |
Jackie Walorski | 2013 | 3rd |
|
22.3% | 23.2% | |||||||||||||||||||||||||||||||||||||||||||||||||||||||||||||||||||||||||||||||||||||||||||
| IN-9 |  |
Trey Hollingsworth | 2017 | 1st |
|
13.7% | 26.9% | |||||||||||||||||||||||||||||||||||||||||||||||||||||||||||||||||||||||||||||||||||||||||||
| KS-2 |  |
Lynn Jenkins | 2009 | 5th |
|
28.4% | 18.4% | |||||||||||||||||||||||||||||||||||||||||||||||||||||||||||||||||||||||||||||||||||||||||||
|
Incumbent not running for re-election in 2018.
|
||||||||||||||||||||||||||||||||||||||||||||||||||||||||||||||||||||||||||||||||||||||||||||||||||
| KS-3 |  |
Kevin Yoder | 2011 | 4th |
|
10.7% | 1.2% | |||||||||||||||||||||||||||||||||||||||||||||||||||||||||||||||||||||||||||||||||||||||||||
| KY-6 |  |
Andy Barr | 2013 | 3rd |
|
22.2% | 15.3% | |||||||||||||||||||||||||||||||||||||||||||||||||||||||||||||||||||||||||||||||||||||||||||
| ME-2 |  |
Bruce Poliquin | 2015 | 2nd |
|
9.6% | 10.3% | |||||||||||||||||||||||||||||||||||||||||||||||||||||||||||||||||||||||||||||||||||||||||||
| MI-1 |  |
Jack Bergman | 2017 | 1st |
|
14.8% | 21.3% | |||||||||||||||||||||||||||||||||||||||||||||||||||||||||||||||||||||||||||||||||||||||||||
| MI-2 |  |
Bill Huizenga | 2011 | 4th |
|
30.1% | 17.6% | |||||||||||||||||||||||||||||||||||||||||||||||||||||||||||||||||||||||||||||||||||||||||||
| MI-3 |  |
Justin Amash | 2011 | 4th |
|
21.9% | 9.4% | |||||||||||||||||||||||||||||||||||||||||||||||||||||||||||||||||||||||||||||||||||||||||||
| MI-6 |  |
Fred Upton | 1987 | 16th |
|
22.2% | 8.4% | |||||||||||||||||||||||||||||||||||||||||||||||||||||||||||||||||||||||||||||||||||||||||||
| MI-7 |  |
Tim Walberg | 2011 | 4th |
|
15.0% | 17.0% | |||||||||||||||||||||||||||||||||||||||||||||||||||||||||||||||||||||||||||||||||||||||||||
| MI-8 |  |
Mike Bishop | 2015 | 2nd |
|
16.9% | 6.7% | |||||||||||||||||||||||||||||||||||||||||||||||||||||||||||||||||||||||||||||||||||||||||||
| MI-11 |  |
Dave Trott | 2015 | 2nd |
|
12.8% | 4.4% | |||||||||||||||||||||||||||||||||||||||||||||||||||||||||||||||||||||||||||||||||||||||||||
|
Incumbent not running for re-election in 2018.
|
||||||||||||||||||||||||||||||||||||||||||||||||||||||||||||||||||||||||||||||||||||||||||||||||||
| MN-1 |  |
Timothy Walz | 2007 | 6th |
|
0.8% | 14.9% | |||||||||||||||||||||||||||||||||||||||||||||||||||||||||||||||||||||||||||||||||||||||||||
|
Incumbent not running for re-election in 2018.
|
||||||||||||||||||||||||||||||||||||||||||||||||||||||||||||||||||||||||||||||||||||||||||||||||||
| MN-2 |  |
Jason Lewis | 2017 | 1st |
|
1.8% | 1.2% | |||||||||||||||||||||||||||||||||||||||||||||||||||||||||||||||||||||||||||||||||||||||||||
| MN-3 |  |
Erik Paulsen | 2009 | 5th |
|
13.7% | 9.4% | |||||||||||||||||||||||||||||||||||||||||||||||||||||||||||||||||||||||||||||||||||||||||||
| MN-7 |  |
Collin Peterson | 1991 | 14th |
|
5.0% | 30.8% | |||||||||||||||||||||||||||||||||||||||||||||||||||||||||||||||||||||||||||||||||||||||||||
| MN-8 |  |
Rick Nolan | 2013 | 3rd |
|
0.6% | 15.6% | |||||||||||||||||||||||||||||||||||||||||||||||||||||||||||||||||||||||||||||||||||||||||||
|
Incumbent not running for re-election in 2018.
|
||||||||||||||||||||||||||||||||||||||||||||||||||||||||||||||||||||||||||||||||||||||||||||||||||
| MO-2 |  |
Ann Wagner | 2013 | 3rd |
|
20.9% | 10.3% | |||||||||||||||||||||||||||||||||||||||||||||||||||||||||||||||||||||||||||||||||||||||||||
| MT-AL |  |
Greg Gianforte | 2017 | 1st |
|
15.6% | 20.6% | |||||||||||||||||||||||||||||||||||||||||||||||||||||||||||||||||||||||||||||||||||||||||||
| NC-2 |  |
George Holding | 2013 | 3rd |
|
13.4% | 9.6% | |||||||||||||||||||||||||||||||||||||||||||||||||||||||||||||||||||||||||||||||||||||||||||
| NC-8 |  |
Richard Hudson | 2013 | 3rd |
|
17.5% | 15.0% | |||||||||||||||||||||||||||||||||||||||||||||||||||||||||||||||||||||||||||||||||||||||||||
| NC-9 |  |
Robert Pittenger | 2013 | 3rd |
|
16.4% | 11.6% | |||||||||||||||||||||||||||||||||||||||||||||||||||||||||||||||||||||||||||||||||||||||||||
|
Incumbent defeated in primary for 2018 election.
|
||||||||||||||||||||||||||||||||||||||||||||||||||||||||||||||||||||||||||||||||||||||||||||||||||
| NC-13 |  |
Ted Budd | 2017 | 1st |
|
12.2% | 9.4% | |||||||||||||||||||||||||||||||||||||||||||||||||||||||||||||||||||||||||||||||||||||||||||
| NE-2 |  |
Don Bacon | 2017 | 1st |
|
1.2% | 2.2% | |||||||||||||||||||||||||||||||||||||||||||||||||||||||||||||||||||||||||||||||||||||||||||
| NH-1 |  |
Carol-Shea Porter | 2017 | 1st |
|
1.3% | 1.6% | |||||||||||||||||||||||||||||||||||||||||||||||||||||||||||||||||||||||||||||||||||||||||||
|
Incumbent not running for re-election in 2018.
|
||||||||||||||||||||||||||||||||||||||||||||||||||||||||||||||||||||||||||||||||||||||||||||||||||
| NJ-2 |  |
Frank LoBiondo | 1995 | 12th |
|
22.0% | 4.6% | |||||||||||||||||||||||||||||||||||||||||||||||||||||||||||||||||||||||||||||||||||||||||||
|
Incumbent not running for re-election in 2018.
|
||||||||||||||||||||||||||||||||||||||||||||||||||||||||||||||||||||||||||||||||||||||||||||||||||
| NJ-3 |  |
Tom MacArthur | 2015 | 2nd |
|
20.4% | 6.2% | |||||||||||||||||||||||||||||||||||||||||||||||||||||||||||||||||||||||||||||||||||||||||||
| NJ-5 |  |
Josh Gottheimer | 2017 | 1st |
|
4.4% | 1.0% | |||||||||||||||||||||||||||||||||||||||||||||||||||||||||||||||||||||||||||||||||||||||||||
| NJ-7 |  |
Leonard Lance | 2009 | 5th |
|
11.0% | 1.1% | |||||||||||||||||||||||||||||||||||||||||||||||||||||||||||||||||||||||||||||||||||||||||||
| NJ-11 |  |
Rodney Frelinghuysen | 1995 | 12th |
|
19.1% | 0.8% | |||||||||||||||||||||||||||||||||||||||||||||||||||||||||||||||||||||||||||||||||||||||||||
|
Incumbent not running for re-election in 2018.
|
||||||||||||||||||||||||||||||||||||||||||||||||||||||||||||||||||||||||||||||||||||||||||||||||||
| NM-2 |  |
Steve Pearce | 2011 | 4th |
|
25.5% | 10.2% | |||||||||||||||||||||||||||||||||||||||||||||||||||||||||||||||||||||||||||||||||||||||||||
|
Incumbent not running for re-election in 2018.
|
||||||||||||||||||||||||||||||||||||||||||||||||||||||||||||||||||||||||||||||||||||||||||||||||||
| NV-3 |  |
Jacky Rosen | 2017 | 1st |
|
1.3% | 1.0% | |||||||||||||||||||||||||||||||||||||||||||||||||||||||||||||||||||||||||||||||||||||||||||
|
Incumbent not running for re-election in 2018.
|
||||||||||||||||||||||||||||||||||||||||||||||||||||||||||||||||||||||||||||||||||||||||||||||||||
| NV-4 |  |
Ruben Kihuen | 2017 | 1st |
|
4.0% | 4.9% | |||||||||||||||||||||||||||||||||||||||||||||||||||||||||||||||||||||||||||||||||||||||||||
|
Incumbent not running for re-election in 2018.
|
||||||||||||||||||||||||||||||||||||||||||||||||||||||||||||||||||||||||||||||||||||||||||||||||||
| NY-1 |  |
Lee Zeldin | 2015 | 2nd |
|
17.9% | 12.3% | |||||||||||||||||||||||||||||||||||||||||||||||||||||||||||||||||||||||||||||||||||||||||||
| NY-2 |  |
Peter King | 1993 | 13th |
|
24.9% | 9.1% | |||||||||||||||||||||||||||||||||||||||||||||||||||||||||||||||||||||||||||||||||||||||||||
| NY-11 |  |
Daniel Donovan | 2015 | 2nd |
|
24.9% | 9.8% | |||||||||||||||||||||||||||||||||||||||||||||||||||||||||||||||||||||||||||||||||||||||||||
| NY-18 |  |
Sean P. Maloney | 2013 | 3rd |
|
11.2% | 1.9% | |||||||||||||||||||||||||||||||||||||||||||||||||||||||||||||||||||||||||||||||||||||||||||
| NY-19 |  |
John Faso | 2017 | 1st |
|
8.6% | 6.8% | |||||||||||||||||||||||||||||||||||||||||||||||||||||||||||||||||||||||||||||||||||||||||||
| NY-21 |  |
Elise Stefanik | 2015 | 2nd |
|
35.1% | 13.9% | |||||||||||||||||||||||||||||||||||||||||||||||||||||||||||||||||||||||||||||||||||||||||||
| NY-22 |  |
Claudia Tenney | 2017 | 1st |
|
5.5% | 15.5% | |||||||||||||||||||||||||||||||||||||||||||||||||||||||||||||||||||||||||||||||||||||||||||
| NY-23 |  |
Tom Reed | 2010 | 5th |
|
15.2% | 14.8% | |||||||||||||||||||||||||||||||||||||||||||||||||||||||||||||||||||||||||||||||||||||||||||
| NY-24 |  |
John Katko | 2015 | 2nd |
|
21.1% | 3.6% | |||||||||||||||||||||||||||||||||||||||||||||||||||||||||||||||||||||||||||||||||||||||||||
| NY-27 |  |
Chris Collins | 2013 | 3rd |
|
34.4% | 24.5% | |||||||||||||||||||||||||||||||||||||||||||||||||||||||||||||||||||||||||||||||||||||||||||
| OH-1 |  |
Steve Chabot | 2011 | 4th |
|
18.4% | 6.6% | |||||||||||||||||||||||||||||||||||||||||||||||||||||||||||||||||||||||||||||||||||||||||||
| OH-7 |  |
Bob Gibbs | 2011 | 4th |
|
35.1% | 29.7% | |||||||||||||||||||||||||||||||||||||||||||||||||||||||||||||||||||||||||||||||||||||||||||
| OH-10 |  |
Michael Turner | 2003 | 8th |
|
31.4% | 7.3% | |||||||||||||||||||||||||||||||||||||||||||||||||||||||||||||||||||||||||||||||||||||||||||
| OH-12 |  |
Troy Balderson | 2018 | 1st |
|
36.7% | 11.3% | |||||||||||||||||||||||||||||||||||||||||||||||||||||||||||||||||||||||||||||||||||||||||||
| OH-14 |  |
David Joyce | 2013 | 3rd |
|
25.2% | 11.5% | |||||||||||||||||||||||||||||||||||||||||||||||||||||||||||||||||||||||||||||||||||||||||||
| OH-15 |  |
Steve Stivers | 2011 | 4th |
|
32.3% | 15.4% | |||||||||||||||||||||||||||||||||||||||||||||||||||||||||||||||||||||||||||||||||||||||||||
| OK-5 |  |
Steve Russell | 2015 | 2nd |
|
20.3% | 13.4% | |||||||||||||||||||||||||||||||||||||||||||||||||||||||||||||||||||||||||||||||||||||||||||
| PA-1 |  |
Brian Fitzpatrick | 2017 | 1st |
|
N/A | 2.0% | |||||||||||||||||||||||||||||||||||||||||||||||||||||||||||||||||||||||||||||||||||||||||||
|
Redrawn PA-1 is mostly current PA-8 (Fitzpatrick)
|
||||||||||||||||||||||||||||||||||||||||||||||||||||||||||||||||||||||||||||||||||||||||||||||||||
| PA-5 |  |
Mary Gay Scanlon | 2018 | 1st |
|
N/A | 28.2% | |||||||||||||||||||||||||||||||||||||||||||||||||||||||||||||||||||||||||||||||||||||||||||
|
Redrawn PA-5 is about 50% current PA-7, vacated by Meehan. Scanlon won special election in PA-7
|
||||||||||||||||||||||||||||||||||||||||||||||||||||||||||||||||||||||||||||||||||||||||||||||||||
| PA-6 |  |
Ryan Costello | 2015 | 2nd |
|
N/A | 9.3% | |||||||||||||||||||||||||||||||||||||||||||||||||||||||||||||||||||||||||||||||||||||||||||
|
Redrawn PA-6 is about 50% current PA-6 (Costello, retiring)
|
||||||||||||||||||||||||||||||||||||||||||||||||||||||||||||||||||||||||||||||||||||||||||||||||||
| PA-7 |  |
Susan Wild | 2018 | 1st |
|
N/A | 1.1% | |||||||||||||||||||||||||||||||||||||||||||||||||||||||||||||||||||||||||||||||||||||||||||
|
Redrawn PA-7 is mostly current PA-15 vacated by Dent. Wild won special election in PA-15
|
||||||||||||||||||||||||||||||||||||||||||||||||||||||||||||||||||||||||||||||||||||||||||||||||||
| PA-8 |  |
Matthew Cartwright | 2013 | 3rd |
|
N/A | 9.5% | |||||||||||||||||||||||||||||||||||||||||||||||||||||||||||||||||||||||||||||||||||||||||||
|
Redrawn PA-8 is about 50% current PA-17 (Cartwright)
|
||||||||||||||||||||||||||||||||||||||||||||||||||||||||||||||||||||||||||||||||||||||||||||||||||
| PA-10 |  |
Scott Perry | 2013 | 3rd |
|
N/A | 8.9% | |||||||||||||||||||||||||||||||||||||||||||||||||||||||||||||||||||||||||||||||||||||||||||
|
Redrawn PA-10 is about 60% current PA-4 (Perry), 30% current PA-11 (Barletta, running for Senate)
|
||||||||||||||||||||||||||||||||||||||||||||||||||||||||||||||||||||||||||||||||||||||||||||||||||
| PA-14 |  |
Conor Lamb | 2018 | 1st |
|
N/A | 29.0% | |||||||||||||||||||||||||||||||||||||||||||||||||||||||||||||||||||||||||||||||||||||||||||
|
Redrawn PA-14 is majority current PA-18. Lamb running for re-election in PA-17
|
||||||||||||||||||||||||||||||||||||||||||||||||||||||||||||||||||||||||||||||||||||||||||||||||||
| PA-16 |  |
Mike Kelly | 2011 | 4th |
|
N/A | 19.9% | |||||||||||||||||||||||||||||||||||||||||||||||||||||||||||||||||||||||||||||||||||||||||||
|
Redrawn PA-16 is mostly current PA-3 (Kelly)
|
||||||||||||||||||||||||||||||||||||||||||||||||||||||||||||||||||||||||||||||||||||||||||||||||||
| PA-17 |  |
Keith Rothfus | 2013 | 3rd |
|
N/A | 2.5% | |||||||||||||||||||||||||||||||||||||||||||||||||||||||||||||||||||||||||||||||||||||||||||
|
Redrawn PA-17 is majority current PA-12 (Rothfus); Conor Lamb (current PA-18) running vs. Rothfus
|
||||||||||||||||||||||||||||||||||||||||||||||||||||||||||||||||||||||||||||||||||||||||||||||||||
| SC-1 |  |
Mark Sanford | 2013 | 3rd |
|
21.7% | 13.1% | |||||||||||||||||||||||||||||||||||||||||||||||||||||||||||||||||||||||||||||||||||||||||||
|
Incumbent defeated in primary for 2018 election.
|
||||||||||||||||||||||||||||||||||||||||||||||||||||||||||||||||||||||||||||||||||||||||||||||||||
| TX-2 |  |
Ted Poe | 2005 | 7th |
|
24.6% | 9.3% | |||||||||||||||||||||||||||||||||||||||||||||||||||||||||||||||||||||||||||||||||||||||||||
|
Incumbent not running for re-election in 2018.
|
||||||||||||||||||||||||||||||||||||||||||||||||||||||||||||||||||||||||||||||||||||||||||||||||||
| TX-6 |  |
Joe Barton | 1985 | 17th |
|
19.3% | 12.3% | |||||||||||||||||||||||||||||||||||||||||||||||||||||||||||||||||||||||||||||||||||||||||||
|
Incumbent not running for re-election in 2018.
|
||||||||||||||||||||||||||||||||||||||||||||||||||||||||||||||||||||||||||||||||||||||||||||||||||
| TX-7 |  |
John Culberson | 2001 | 9th |
|
12.3% | 1.4% | |||||||||||||||||||||||||||||||||||||||||||||||||||||||||||||||||||||||||||||||||||||||||||
| TX-10 |  |
Michael McCaul | 2005 | 7th |
|
18.9% | 9.0% | |||||||||||||||||||||||||||||||||||||||||||||||||||||||||||||||||||||||||||||||||||||||||||
| TX-21 |  |
Lamar Smith | 1987 | 16th |
|
20.6% | 10.0% | |||||||||||||||||||||||||||||||||||||||||||||||||||||||||||||||||||||||||||||||||||||||||||
|
Incumbent not running for re-election in 2018.
|
||||||||||||||||||||||||||||||||||||||||||||||||||||||||||||||||||||||||||||||||||||||||||||||||||
| TX-22 |  |
Pete Olson | 2009 | 5th |
|
19.0% | 7.9% | |||||||||||||||||||||||||||||||||||||||||||||||||||||||||||||||||||||||||||||||||||||||||||
| TX-23 |  |
Will Hurd | 2015 | 2nd |
|
1.3% | 3.4% | |||||||||||||||||||||||||||||||||||||||||||||||||||||||||||||||||||||||||||||||||||||||||||
| TX-24 |  |
Kenny Marchant | 2005 | 7th |
|
16.9% | 6.2% | |||||||||||||||||||||||||||||||||||||||||||||||||||||||||||||||||||||||||||||||||||||||||||
| TX-31 |  |
John Carter | 2003 | 8th |
|
21.9% | 12.7% | |||||||||||||||||||||||||||||||||||||||||||||||||||||||||||||||||||||||||||||||||||||||||||
| TX-32 |  |
Pete Sessions | 1997 | 11th |
|
52.1% | 1.9% | |||||||||||||||||||||||||||||||||||||||||||||||||||||||||||||||||||||||||||||||||||||||||||
| UT-4 |  |
Mia Love | 2015 | 2nd |
|
12.5% | 6.7% | |||||||||||||||||||||||||||||||||||||||||||||||||||||||||||||||||||||||||||||||||||||||||||
| VA-2 |  |
Scott Taylor | 2017 | 1st |
|
22.9% | 3.4% | |||||||||||||||||||||||||||||||||||||||||||||||||||||||||||||||||||||||||||||||||||||||||||
| VA-5 |  |
Tom Garrett | 2017 | 1st |
|
16.7% | 11.1% | |||||||||||||||||||||||||||||||||||||||||||||||||||||||||||||||||||||||||||||||||||||||||||
|
Incumbent not running for re-election in 2018.
|
||||||||||||||||||||||||||||||||||||||||||||||||||||||||||||||||||||||||||||||||||||||||||||||||||
| VA-7 |  |
Dave Brat | 2014 | 3rd |
|
15.3% | 6.5% | |||||||||||||||||||||||||||||||||||||||||||||||||||||||||||||||||||||||||||||||||||||||||||
| VA-10 |  |
Barbara Comstock | 2015 | 2nd |
|
5.8% | 10.0% | |||||||||||||||||||||||||||||||||||||||||||||||||||||||||||||||||||||||||||||||||||||||||||
| WA-3 |  |
Jaime Herrera Beutler | 2011 | 4th |
|
23.5% | 7.4% | |||||||||||||||||||||||||||||||||||||||||||||||||||||||||||||||||||||||||||||||||||||||||||
| WA-5 |  |
Cathy McMorris Rodgers | 2005 | 7th |
|
19.3% | 13.1% | |||||||||||||||||||||||||||||||||||||||||||||||||||||||||||||||||||||||||||||||||||||||||||
| WA-8 |  |
Dave Reichert | 2005 | 7th |
|
20.4% | 3.0% | |||||||||||||||||||||||||||||||||||||||||||||||||||||||||||||||||||||||||||||||||||||||||||
|
Incumbent not running for re-election in 2018.
|
||||||||||||||||||||||||||||||||||||||||||||||||||||||||||||||||||||||||||||||||||||||||||||||||||
| WI-1 |  |
Paul Ryan | 1999 | 10th |
|
34.8% | 10.3% | |||||||||||||||||||||||||||||||||||||||||||||||||||||||||||||||||||||||||||||||||||||||||||
|
Incumbent not running for re-election in 2018.
|
||||||||||||||||||||||||||||||||||||||||||||||||||||||||||||||||||||||||||||||||||||||||||||||||||
| WI-6 |  |
Glenn Grothman | 2015 | 2nd |
|
19.9% | 16.9% | |||||||||||||||||||||||||||||||||||||||||||||||||||||||||||||||||||||||||||||||||||||||||||
| WV-2 |  |
Alex Mooney | 2015 | 2nd |
|
16.4% | 36.4% | |||||||||||||||||||||||||||||||||||||||||||||||||||||||||||||||||||||||||||||||||||||||||||
| WV-3 |  |
OPEN |
|
43.9% | 49.2% | |||||||||||||||||||||||||||||||||||||||||||||||||||||||||||||||||||||||||||||||||||||||||||||
| AL-1 |  |
Bradley Byrne | 2014 | 3rd |
|
* | 29.4% | |||||||||||||||||||||||||||||||||||||||||||||||||||||||||||||||||||||||||||||||||||||||||||
| AL-2 |  |
Martha Roby | 2011 | 4th |
|
8.2% | 31.9% | |||||||||||||||||||||||||||||||||||||||||||||||||||||||||||||||||||||||||||||||||||||||||||
| AL-3 |  |
Mike Rogers | 2003 | 8th |
|
34.0% | 33.0% | |||||||||||||||||||||||||||||||||||||||||||||||||||||||||||||||||||||||||||||||||||||||||||
| AL-4 |  |
Robert Aderholt | 1997 | 11th |
|
* | 63.0% | |||||||||||||||||||||||||||||||||||||||||||||||||||||||||||||||||||||||||||||||||||||||||||
| AL-5 |  |
Mo Brooks | 2011 | 4th |
|
33.5% | 33.4% | |||||||||||||||||||||||||||||||||||||||||||||||||||||||||||||||||||||||||||||||||||||||||||
| AL-6 |  |
Gary Palmer | 2015 | 2nd |
|
49.1% | 44.7% | |||||||||||||||||||||||||||||||||||||||||||||||||||||||||||||||||||||||||||||||||||||||||||
| AL-7 |  |
Terri Sewell | 2011 | 4th |
|
* | 41.2% | |||||||||||||||||||||||||||||||||||||||||||||||||||||||||||||||||||||||||||||||||||||||||||
| AR-1 |  |
Rick Crawford | 2011 | 4th |
|
52.6% | 34.8% | |||||||||||||||||||||||||||||||||||||||||||||||||||||||||||||||||||||||||||||||||||||||||||
| AR-3 |  |
Steve Womack | 2011 | 4th |
|
54.6% | 31.4% | |||||||||||||||||||||||||||||||||||||||||||||||||||||||||||||||||||||||||||||||||||||||||||
| AR-4 |  |
Bruce Westerman | 2015 | 2nd |
|
49.8% | 32.9% | |||||||||||||||||||||||||||||||||||||||||||||||||||||||||||||||||||||||||||||||||||||||||||
| AZ-3 |  |
Raul Grijalva | 2003 | 8th |
|
* | 29.9% | |||||||||||||||||||||||||||||||||||||||||||||||||||||||||||||||||||||||||||||||||||||||||||
| AZ-4 |  |
Paul Gosar | 2011 | 4th |
|
42.9% | 40.2% | |||||||||||||||||||||||||||||||||||||||||||||||||||||||||||||||||||||||||||||||||||||||||||
| AZ-5 |  |
Andy Biggs | 2017 | 1st |
|
28.2% | 21.1% | |||||||||||||||||||||||||||||||||||||||||||||||||||||||||||||||||||||||||||||||||||||||||||
| AZ-7 |  |
Ruben Gallego | 2015 | 2nd |
|
50.5% | 49.2% | |||||||||||||||||||||||||||||||||||||||||||||||||||||||||||||||||||||||||||||||||||||||||||
| AZ-9 |  |
Kyrsten Sinema | 2013 | 3rd |
|
21.9% | 16.3% | |||||||||||||||||||||||||||||||||||||||||||||||||||||||||||||||||||||||||||||||||||||||||||
|
Incumbent not running for re-election in 2018.
|
||||||||||||||||||||||||||||||||||||||||||||||||||||||||||||||||||||||||||||||||||||||||||||||||||
| CA-2 |  |
Jared Huffman | 2013 | 3rd |
|
53.7% | 45.7% | |||||||||||||||||||||||||||||||||||||||||||||||||||||||||||||||||||||||||||||||||||||||||||
| CA-3 |  |
John Garamendi | 2009 | 5th |
|
18.7% | 12.6% | |||||||||||||||||||||||||||||||||||||||||||||||||||||||||||||||||||||||||||||||||||||||||||
| CA-5 |  |
Mike Thompson | 1999 | 10th |
|
53.7% | 44.9% | |||||||||||||||||||||||||||||||||||||||||||||||||||||||||||||||||||||||||||||||||||||||||||
| CA-6 |  |
Doris Matsui | 2005 | 7th |
|
50.9% | 44.8% | |||||||||||||||||||||||||||||||||||||||||||||||||||||||||||||||||||||||||||||||||||||||||||
| CA-8 |  |
Paul Cook | 2013 | 3rd |
|
24.5% | 15.1% | |||||||||||||||||||||||||||||||||||||||||||||||||||||||||||||||||||||||||||||||||||||||||||
| CA-9 |  |
Jerry McNerney | 2007 | 6th |
|
14.7% | 18.6% | |||||||||||||||||||||||||||||||||||||||||||||||||||||||||||||||||||||||||||||||||||||||||||
| CA-11 |  |
Mark DeSaulnier | 2015 | 2nd |
|
44.1% | 48.8% | |||||||||||||||||||||||||||||||||||||||||||||||||||||||||||||||||||||||||||||||||||||||||||
| CA-12 |  |
Nancy Pelosi | 1987 | 16th |
|
61.7% | 77.5% | |||||||||||||||||||||||||||||||||||||||||||||||||||||||||||||||||||||||||||||||||||||||||||
| CA-13 |  |
Barbara Lee | 1998 | 11th |
|
81.6% | 80.6% | |||||||||||||||||||||||||||||||||||||||||||||||||||||||||||||||||||||||||||||||||||||||||||
| CA-14 |  |
Jackie Speier | 2008 | 6th |
|
61.7% | 58.7% | |||||||||||||||||||||||||||||||||||||||||||||||||||||||||||||||||||||||||||||||||||||||||||
| CA-15 |  |
Eric Swalwell | 2013 | 3rd |
|
47.5% | 45.7% | |||||||||||||||||||||||||||||||||||||||||||||||||||||||||||||||||||||||||||||||||||||||||||
| CA-17 |  |
Ro Khanna | 2017 | 1st |
|
22.0% ^ | 53.4% | |||||||||||||||||||||||||||||||||||||||||||||||||||||||||||||||||||||||||||||||||||||||||||
| CA-18 |  |
Anna Eshoo | 1993 | 13th |
|
42.3% | 53.2% | |||||||||||||||||||||||||||||||||||||||||||||||||||||||||||||||||||||||||||||||||||||||||||
| CA-19 |  |
Zoe Lofgren | 1995 | 12th |
|
47.9% | 51.4% | |||||||||||||||||||||||||||||||||||||||||||||||||||||||||||||||||||||||||||||||||||||||||||
| CA-20 |  |
Jimmy Panetta | 2017 | 1st |
|
41.5% | 47.2% | |||||||||||||||||||||||||||||||||||||||||||||||||||||||||||||||||||||||||||||||||||||||||||
| CA-23 |  |
Kevin McCarthy | 2007 | 6th |
|
38.4% | 22.0% | |||||||||||||||||||||||||||||||||||||||||||||||||||||||||||||||||||||||||||||||||||||||||||
| CA-26 |  |
Julia Brownley | 2013 | 3rd |
|
20.8% | 21.9% | |||||||||||||||||||||||||||||||||||||||||||||||||||||||||||||||||||||||||||||||||||||||||||
| CA-27 |  |
Judy Chu | 2009 | 5th |
|
34.8% | 37.6% | |||||||||||||||||||||||||||||||||||||||||||||||||||||||||||||||||||||||||||||||||||||||||||
| CA-28 |  |
Adam Schiff | 2001 | 9th |
|
56.0% | 49.8% | |||||||||||||||||||||||||||||||||||||||||||||||||||||||||||||||||||||||||||||||||||||||||||
| CA-29 |  |
Tony Cardenas | 2013 | 3rd |
|
49.5% ^ | 60.9% | |||||||||||||||||||||||||||||||||||||||||||||||||||||||||||||||||||||||||||||||||||||||||||
| CA-30 |  |
Brad Sherman | 1997 | 11th |
|
45.3% | 43.4% | |||||||||||||||||||||||||||||||||||||||||||||||||||||||||||||||||||||||||||||||||||||||||||
| CA-31 |  |
Pete Aguilar | 2015 | 2nd |
|
12.1% | 21.1% | |||||||||||||||||||||||||||||||||||||||||||||||||||||||||||||||||||||||||||||||||||||||||||
| CA-32 |  |
Grace Napolitano | 1999 | 10th |
|
23.1% ^ | 38.9% | |||||||||||||||||||||||||||||||||||||||||||||||||||||||||||||||||||||||||||||||||||||||||||
| CA-33 |  |
Ted Lieu | 2015 | 2nd |
|
32.9% | 41.3% | |||||||||||||||||||||||||||||||||||||||||||||||||||||||||||||||||||||||||||||||||||||||||||
| CA-34 |  |
Jimmy Gomez | 2017 | 1st |
|
54.4% | 72.9% | |||||||||||||||||||||||||||||||||||||||||||||||||||||||||||||||||||||||||||||||||||||||||||
| CA-35 |  |
Norma Torres | 2015 | 2nd |
|
44.8% | 40.8% | |||||||||||||||||||||||||||||||||||||||||||||||||||||||||||||||||||||||||||||||||||||||||||
| CA-36 |  |
Raul Ruiz | 2013 | 3rd |
|
24.1% | 8.8% | |||||||||||||||||||||||||||||||||||||||||||||||||||||||||||||||||||||||||||||||||||||||||||
| CA-37 |  |
Karen Bass | 2011 | 4th |
|
62.3% ^ | 76.1% | |||||||||||||||||||||||||||||||||||||||||||||||||||||||||||||||||||||||||||||||||||||||||||
| CA-38 |  |
Linda Sanchez | 2003 | 8th |
|
41.0% | 39.6% | |||||||||||||||||||||||||||||||||||||||||||||||||||||||||||||||||||||||||||||||||||||||||||
| CA-40 |  |
Lucille Roybal-Allard | 1993 | 13th |
|
62.3% | 69.4% | |||||||||||||||||||||||||||||||||||||||||||||||||||||||||||||||||||||||||||||||||||||||||||
| CA-41 |  |
Mark Takano | 2013 | 3rd |
|
29.9% | 27.9% | |||||||||||||||||||||||||||||||||||||||||||||||||||||||||||||||||||||||||||||||||||||||||||
| CA-42 |  |
Ken Calvert | 1993 | 13th |
|
17.6% | 12.0% | |||||||||||||||||||||||||||||||||||||||||||||||||||||||||||||||||||||||||||||||||||||||||||
| CA-43 |  |
Maxine Waters | 1991 | 14th |
|
52.2% | 61.7% | |||||||||||||||||||||||||||||||||||||||||||||||||||||||||||||||||||||||||||||||||||||||||||
| CA-44 |  |
Nanette Barragan | 2017 | 1st |
|
4.4% ^ | 70.7% | |||||||||||||||||||||||||||||||||||||||||||||||||||||||||||||||||||||||||||||||||||||||||||
| CA-46 |  |
Lou Correa | 2017 | 1st |
|
40.0% ^ | 38.4% | |||||||||||||||||||||||||||||||||||||||||||||||||||||||||||||||||||||||||||||||||||||||||||
| CA-47 |  |
Alan Lowenthal | 2013 | 3rd |
|
27.4% | 31.6% | |||||||||||||||||||||||||||||||||||||||||||||||||||||||||||||||||||||||||||||||||||||||||||
| CA-51 |  |
Juan Vargas | 2013 | 3rd |
|
45.5% | 49.0% | |||||||||||||||||||||||||||||||||||||||||||||||||||||||||||||||||||||||||||||||||||||||||||
| CA-52 |  |
Scott Peters | 2013 | 3rd |
|
13.1% | 22.5% | |||||||||||||||||||||||||||||||||||||||||||||||||||||||||||||||||||||||||||||||||||||||||||
| CA-53 |  |
Susan Davis | 2001 | 9th |
|
34.0% | 34.9% | |||||||||||||||||||||||||||||||||||||||||||||||||||||||||||||||||||||||||||||||||||||||||||
| CO-1 |  |
Diana DeGette | 1997 | 11th |
|
40.2% | 45.8% | |||||||||||||||||||||||||||||||||||||||||||||||||||||||||||||||||||||||||||||||||||||||||||
| CO-2 |  |
Jared Polis | 2009 | 5th |
|
19.7% | 21.3% | |||||||||||||||||||||||||||||||||||||||||||||||||||||||||||||||||||||||||||||||||||||||||||
|
Incumbent not running for re-election in 2018.
|
||||||||||||||||||||||||||||||||||||||||||||||||||||||||||||||||||||||||||||||||||||||||||||||||||
| CO-4 |  |
Ken Buck | 2015 | 2nd |
|
31.9% | 23.1% | |||||||||||||||||||||||||||||||||||||||||||||||||||||||||||||||||||||||||||||||||||||||||||
| CO-5 |  |
Doug Lamborn | 2007 | 6th |
|
31.4% | 24.0% | |||||||||||||||||||||||||||||||||||||||||||||||||||||||||||||||||||||||||||||||||||||||||||
| CO-7 |  |
Ed Perlmutter | 2007 | 6th |
|
15.4% | 12.0% | |||||||||||||||||||||||||||||||||||||||||||||||||||||||||||||||||||||||||||||||||||||||||||
| CT-1 |  |
John Larson | 1999 | 10th |
|
30.4% | 23.1% | |||||||||||||||||||||||||||||||||||||||||||||||||||||||||||||||||||||||||||||||||||||||||||
| CT-2 |  |
Joe Courtney | 2007 | 6th |
|
29.6% | 2.9% | |||||||||||||||||||||||||||||||||||||||||||||||||||||||||||||||||||||||||||||||||||||||||||
| CT-3 |  |
Rosa DeLauro | 1991 | 14th |
|
38.1% | 15.5% | |||||||||||||||||||||||||||||||||||||||||||||||||||||||||||||||||||||||||||||||||||||||||||
| CT-4 |  |
James Himes | 2009 | 5th |
|
19.8% | 23.0% | |||||||||||||||||||||||||||||||||||||||||||||||||||||||||||||||||||||||||||||||||||||||||||
| CT-5 |  |
Elizabeth Esty | 2013 | 3rd |
|
16.0% | 4.1% | |||||||||||||||||||||||||||||||||||||||||||||||||||||||||||||||||||||||||||||||||||||||||||
|
Incumbent not running for re-election in 2018.
|
||||||||||||||||||||||||||||||||||||||||||||||||||||||||||||||||||||||||||||||||||||||||||||||||||
| DE-AL |  |
Lisa Rochester | 2017 | 1st |
|
14.6% | 11.5% | |||||||||||||||||||||||||||||||||||||||||||||||||||||||||||||||||||||||||||||||||||||||||||
| FL-1 | 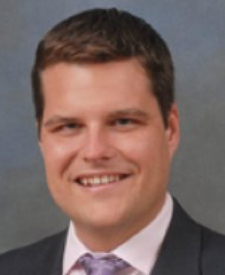 |
Matt Gaetz | 2017 | 1st |
|
38.2% | 39.3% | |||||||||||||||||||||||||||||||||||||||||||||||||||||||||||||||||||||||||||||||||||||||||||
| FL-2 | 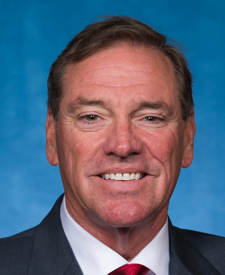 |
Neal Dunn | 2017 | 1st |
|
37.4% | 35.6% | |||||||||||||||||||||||||||||||||||||||||||||||||||||||||||||||||||||||||||||||||||||||||||
| FL-3 | 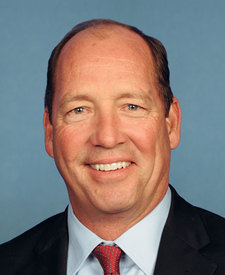 |
Ted Yoho | 2013 | 3rd |
|
16.8% | 16.0% | |||||||||||||||||||||||||||||||||||||||||||||||||||||||||||||||||||||||||||||||||||||||||||
| FL-4 | 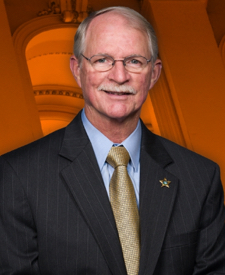 |
John Rutherford | 2017 | 1st |
|
42.6% | 28.0% | |||||||||||||||||||||||||||||||||||||||||||||||||||||||||||||||||||||||||||||||||||||||||||
| FL-5 | 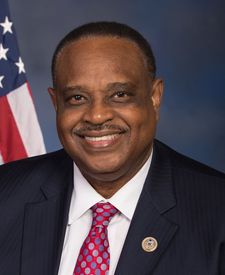 |
Al Lawson | 2017 | 1st |
|
28.5% | 25.4% | |||||||||||||||||||||||||||||||||||||||||||||||||||||||||||||||||||||||||||||||||||||||||||
| FL-8 | 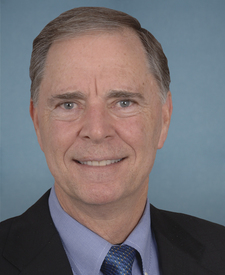 |
Bill Posey | 2009 | 5th |
|
30.6% | 20.7% | |||||||||||||||||||||||||||||||||||||||||||||||||||||||||||||||||||||||||||||||||||||||||||
| FL-9 | 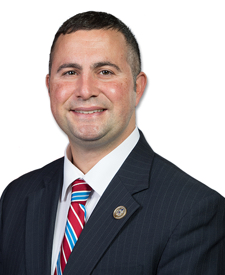 |
Darren Soto | 2017 | 1st |
|
15.0% | 12.9% | |||||||||||||||||||||||||||||||||||||||||||||||||||||||||||||||||||||||||||||||||||||||||||
| FL-10 | 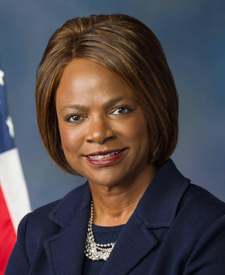 |
Val Demings | 2017 | 1st |
|
29.7% | 26.9% | |||||||||||||||||||||||||||||||||||||||||||||||||||||||||||||||||||||||||||||||||||||||||||
| FL-11 |  |
Dan Webster | 2017 | 1st |
|
33.8% | 32.3% | |||||||||||||||||||||||||||||||||||||||||||||||||||||||||||||||||||||||||||||||||||||||||||
| FL-12 |  |
Gus Bilirakis | 2007 | 6th |
|
37.2% | 18.6% | |||||||||||||||||||||||||||||||||||||||||||||||||||||||||||||||||||||||||||||||||||||||||||
| FL-13 |  |
Charlie Crist | 2017 | 1st |
|
3.8% | 3.2% | |||||||||||||||||||||||||||||||||||||||||||||||||||||||||||||||||||||||||||||||||||||||||||
| FL-14 |  |
Kathy Castor | 2007 | 6th |
|
23.6% | 18.2% | |||||||||||||||||||||||||||||||||||||||||||||||||||||||||||||||||||||||||||||||||||||||||||
| FL-17 |  |
Thomas Rooney | 2009 | 5th |
|
27.6% | 27.2% | |||||||||||||||||||||||||||||||||||||||||||||||||||||||||||||||||||||||||||||||||||||||||||
|
Incumbent not running for re-election in 2018.
|
||||||||||||||||||||||||||||||||||||||||||||||||||||||||||||||||||||||||||||||||||||||||||||||||||
| FL-19 |  |
Francis Rooney | 2017 | 1st |
|
31.8% | 22.1% | |||||||||||||||||||||||||||||||||||||||||||||||||||||||||||||||||||||||||||||||||||||||||||
| FL-20 |  |
Alcee Hastings | 1993 | 13th |
|
60.6% | 62.1% | |||||||||||||||||||||||||||||||||||||||||||||||||||||||||||||||||||||||||||||||||||||||||||
| FL-21 |  |
Lois Frankel | 2013 | 3rd |
|
17.9% | 15.8% | |||||||||||||||||||||||||||||||||||||||||||||||||||||||||||||||||||||||||||||||||||||||||||
| FL-22 |  |
Ted Deutch | 2010 | 5th |
|
27.6% | 19.5% | |||||||||||||||||||||||||||||||||||||||||||||||||||||||||||||||||||||||||||||||||||||||||||
| FL-23 |  |
Debbie Wasserman Schultz | 2005 | 7th |
|
16.2% | 26.1% | |||||||||||||||||||||||||||||||||||||||||||||||||||||||||||||||||||||||||||||||||||||||||||
| FL-24 |  |
Frederica Wilson | 2011 | 4th |
|
* | 67.5% | |||||||||||||||||||||||||||||||||||||||||||||||||||||||||||||||||||||||||||||||||||||||||||
| GA-1 |  |
Buddy Carter | 2015 | 2nd |
|
* | 15.5% | |||||||||||||||||||||||||||||||||||||||||||||||||||||||||||||||||||||||||||||||||||||||||||
| GA-2 |  |
Sanford D. Jr. Bishop | 1993 | 13th |
|
22.5% | 11.7% | |||||||||||||||||||||||||||||||||||||||||||||||||||||||||||||||||||||||||||||||||||||||||||
| GA-3 |  |
Drew Ferguson | 2017 | 1st |
|
36.7% | 31.5% | |||||||||||||||||||||||||||||||||||||||||||||||||||||||||||||||||||||||||||||||||||||||||||
| GA-4 |  |
Henry C. 'Hank' Jr. Johnson | 2007 | 6th |
|
51.4% | 53.1% | |||||||||||||||||||||||||||||||||||||||||||||||||||||||||||||||||||||||||||||||||||||||||||
| GA-5 |  |
John Lewis | 1987 | 16th |
|
68.9% | 73.1% | |||||||||||||||||||||||||||||||||||||||||||||||||||||||||||||||||||||||||||||||||||||||||||
| GA-8 |  |
Austin Scott | 2011 | 4th |
|
35.3% | 28.9% | |||||||||||||||||||||||||||||||||||||||||||||||||||||||||||||||||||||||||||||||||||||||||||
| GA-9 |  |
Doug Collins | 2013 | 3rd |
|
* | 58.5% | |||||||||||||||||||||||||||||||||||||||||||||||||||||||||||||||||||||||||||||||||||||||||||
| GA-10 |  |
Jody Hice | 2015 | 2nd |
|
* | 25.5% | |||||||||||||||||||||||||||||||||||||||||||||||||||||||||||||||||||||||||||||||||||||||||||
| GA-11 |  |
Barry Loudermilk | 2015 | 2nd |
|
34.8% | 25.0% | |||||||||||||||||||||||||||||||||||||||||||||||||||||||||||||||||||||||||||||||||||||||||||
| GA-12 |  |
Rick Allen | 2015 | 2nd |
|
23.2% | 16.2% | |||||||||||||||||||||||||||||||||||||||||||||||||||||||||||||||||||||||||||||||||||||||||||
| GA-13 |  |
David Scott | 2003 | 8th |
|
* | 44.4% | |||||||||||||||||||||||||||||||||||||||||||||||||||||||||||||||||||||||||||||||||||||||||||
| GA-14 |  |
Tom Graves | 2010 | 5th |
|
* | 52.9% | |||||||||||||||||||||||||||||||||||||||||||||||||||||||||||||||||||||||||||||||||||||||||||
| HI-1 |  |
Colleen Hanabusa | 2016 | 2nd |
|
49.2% | 32.6% | |||||||||||||||||||||||||||||||||||||||||||||||||||||||||||||||||||||||||||||||||||||||||||
|
Incumbent not running for re-election in 2018.
|
||||||||||||||||||||||||||||||||||||||||||||||||||||||||||||||||||||||||||||||||||||||||||||||||||
| HI-2 |  |
Tulsi Gabbard | 2013 | 3rd |
|
62.3% | 31.8% | |||||||||||||||||||||||||||||||||||||||||||||||||||||||||||||||||||||||||||||||||||||||||||
| IA-2 |  |
David Loebsack | 2007 | 6th |
|
7.5% | 4.1% | |||||||||||||||||||||||||||||||||||||||||||||||||||||||||||||||||||||||||||||||||||||||||||
| ID-1 |  |
Raul Labrador | 2011 | 4th |
|
36.4% | 38.3% | |||||||||||||||||||||||||||||||||||||||||||||||||||||||||||||||||||||||||||||||||||||||||||
|
Incumbent not running for re-election in 2018.
|
||||||||||||||||||||||||||||||||||||||||||||||||||||||||||||||||||||||||||||||||||||||||||||||||||
| ID-2 |  |
Michael Simpson | 1999 | 10th |
|
33.5% | 24.7% | |||||||||||||||||||||||||||||||||||||||||||||||||||||||||||||||||||||||||||||||||||||||||||
| IL-1 |  |
Bobby Rush | 1993 | 13th |
|
48.2% | 54.0% | |||||||||||||||||||||||||||||||||||||||||||||||||||||||||||||||||||||||||||||||||||||||||||
| IL-2 |  |
Robin Kelly | 2013 | 3rd |
|
59.6% | 58.9% | |||||||||||||||||||||||||||||||||||||||||||||||||||||||||||||||||||||||||||||||||||||||||||
| IL-3 |  |
Daniel Lipinski | 2005 | 7th |
|
* | 15.3% | |||||||||||||||||||||||||||||||||||||||||||||||||||||||||||||||||||||||||||||||||||||||||||
| IL-4 |  |
Luis Gutierrez | 1993 | 13th |
|
* | 68.9% | |||||||||||||||||||||||||||||||||||||||||||||||||||||||||||||||||||||||||||||||||||||||||||
|
Incumbent not running for re-election in 2018.
|
||||||||||||||||||||||||||||||||||||||||||||||||||||||||||||||||||||||||||||||||||||||||||||||||||
| IL-5 |  |
Mike Quigley | 2009 | 5th |
|
40.4% | 46.6% | |||||||||||||||||||||||||||||||||||||||||||||||||||||||||||||||||||||||||||||||||||||||||||
| IL-7 |  |
Danny Davis | 1997 | 11th |
|
68.5% | 78.2% | |||||||||||||||||||||||||||||||||||||||||||||||||||||||||||||||||||||||||||||||||||||||||||
| IL-8 |  |
Raja Krishnamoorthi | 2017 | 1st |
|
16.6% | 21.7% | |||||||||||||||||||||||||||||||||||||||||||||||||||||||||||||||||||||||||||||||||||||||||||
| IL-9 |  |
Janice Schakowsky | 1999 | 10th |
|
33.0% | 45.2% | |||||||||||||||||||||||||||||||||||||||||||||||||||||||||||||||||||||||||||||||||||||||||||
| IL-10 |  |
Brad Schneider | 2017 | 1st |
|
5.2% | 29.4% | |||||||||||||||||||||||||||||||||||||||||||||||||||||||||||||||||||||||||||||||||||||||||||
| IL-11 |  |
Bill Foster | 2013 | 3rd |
|
20.9% | 23.5% | |||||||||||||||||||||||||||||||||||||||||||||||||||||||||||||||||||||||||||||||||||||||||||
| IL-15 |  |
John Shimkus | 1997 | 11th |
|
* | 46.2% | |||||||||||||||||||||||||||||||||||||||||||||||||||||||||||||||||||||||||||||||||||||||||||
| IL-16 |  |
Adam Kinzinger | 2011 | 4th |
|
* | 17.2% | |||||||||||||||||||||||||||||||||||||||||||||||||||||||||||||||||||||||||||||||||||||||||||
| IL-17 |  |
Cheri Bustos | 2013 | 3rd |
|
20.6% | 0.6% | |||||||||||||||||||||||||||||||||||||||||||||||||||||||||||||||||||||||||||||||||||||||||||
| IL-18 | 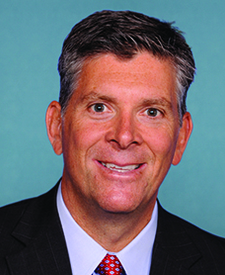 |
Darin LaHood | 2015 | 2nd |
|
44.3% | 27.3% | |||||||||||||||||||||||||||||||||||||||||||||||||||||||||||||||||||||||||||||||||||||||||||
| IN-1 | 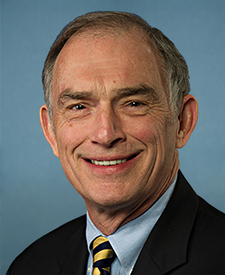 |
Peter Visclosky | 1985 | 17th |
|
63.0% | 12.6% | |||||||||||||||||||||||||||||||||||||||||||||||||||||||||||||||||||||||||||||||||||||||||||
| IN-3 |  |
Jim Banks | 2017 | 1st |
|
47.1% | 35.0% | |||||||||||||||||||||||||||||||||||||||||||||||||||||||||||||||||||||||||||||||||||||||||||
| IN-4 | 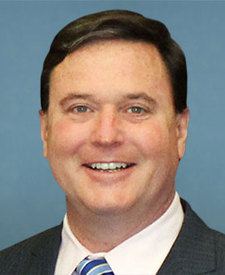 |
Todd Rokita | 2011 | 4th |
|
34.1% | 34.1% | |||||||||||||||||||||||||||||||||||||||||||||||||||||||||||||||||||||||||||||||||||||||||||
|
Incumbent not running for re-election in 2018.
|
||||||||||||||||||||||||||||||||||||||||||||||||||||||||||||||||||||||||||||||||||||||||||||||||||
| IN-5 | 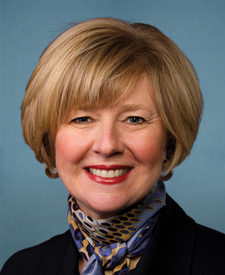 |
Susan Brooks | 2013 | 3rd |
|
27.2% | 11.8% | |||||||||||||||||||||||||||||||||||||||||||||||||||||||||||||||||||||||||||||||||||||||||||
| IN-6 |  |
Luke Messer | 2013 | 3rd |
|
42.4% | 40.3% | |||||||||||||||||||||||||||||||||||||||||||||||||||||||||||||||||||||||||||||||||||||||||||
|
Incumbent not running for re-election in 2018.
|
||||||||||||||||||||||||||||||||||||||||||||||||||||||||||||||||||||||||||||||||||||||||||||||||||
| IN-7 | 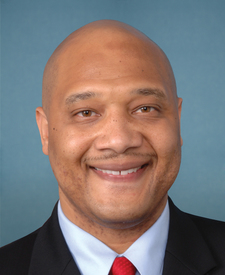 |
Andre Carson | 2008 | 6th |
|
24.3% | 22.8% | |||||||||||||||||||||||||||||||||||||||||||||||||||||||||||||||||||||||||||||||||||||||||||
| IN-8 | 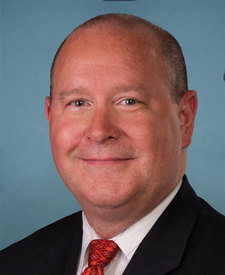 |
Larry Bucshon | 2011 | 4th |
|
32.0% | 33.7% | |||||||||||||||||||||||||||||||||||||||||||||||||||||||||||||||||||||||||||||||||||||||||||
| KS-1 |  |
Roger Marshall | 2017 | 1st |
|
39.6% | 45.0% | |||||||||||||||||||||||||||||||||||||||||||||||||||||||||||||||||||||||||||||||||||||||||||
| KS-4 |  |
Ron Estes | 2017 | 1st |
|
31.1% | 27.2% | |||||||||||||||||||||||||||||||||||||||||||||||||||||||||||||||||||||||||||||||||||||||||||
| KY-1 |  |
James Comer | 2016 | 2nd |
|
45.2% | 48.5% | |||||||||||||||||||||||||||||||||||||||||||||||||||||||||||||||||||||||||||||||||||||||||||
| KY-2 |  |
Brett Guthrie | 2009 | 5th |
|
* | 39.9% | |||||||||||||||||||||||||||||||||||||||||||||||||||||||||||||||||||||||||||||||||||||||||||
| KY-3 |  |
John Yarmuth | 2007 | 6th |
|
27.0% | 15.0% | |||||||||||||||||||||||||||||||||||||||||||||||||||||||||||||||||||||||||||||||||||||||||||
| KY-4 |  |
Thomas Massie | 2012 | 4th |
|
42.6% | 35.9% | |||||||||||||||||||||||||||||||||||||||||||||||||||||||||||||||||||||||||||||||||||||||||||
| KY-5 |  |
Harold Rogers | 1981 | 19th |
|
* | 62.1% | |||||||||||||||||||||||||||||||||||||||||||||||||||||||||||||||||||||||||||||||||||||||||||
| LA-1 |  |
Steve Scalise | 2008 | 6th |
|
61.8% | 42.0% | |||||||||||||||||||||||||||||||||||||||||||||||||||||||||||||||||||||||||||||||||||||||||||
| LA-2 |  |
Cedric Richmond | 2011 | 4th |
|
49.7% ^ | 52.4% | |||||||||||||||||||||||||||||||||||||||||||||||||||||||||||||||||||||||||||||||||||||||||||
| LA-3 |  |
Clay Higgins | 2017 | 1st |
|
12.2% ^ | 38.1% | |||||||||||||||||||||||||||||||||||||||||||||||||||||||||||||||||||||||||||||||||||||||||||
| LA-4 |  |
Mike Johnson | 2017 | 1st |
|
30.5% | 24.0% | |||||||||||||||||||||||||||||||||||||||||||||||||||||||||||||||||||||||||||||||||||||||||||
| LA-5 |  |
Ralph Abraham | 2015 | 2nd |
|
63.1% ^ | 29.4% | |||||||||||||||||||||||||||||||||||||||||||||||||||||||||||||||||||||||||||||||||||||||||||
| LA-6 |  |
Garret Graves | 2015 | 2nd |
|
47.8% | 33.8% | |||||||||||||||||||||||||||||||||||||||||||||||||||||||||||||||||||||||||||||||||||||||||||
| MA-1 |  |
Richard Neal | 1989 | 15th |
|
55.5% | 20.7% | |||||||||||||||||||||||||||||||||||||||||||||||||||||||||||||||||||||||||||||||||||||||||||
| MA-2 |  |
James McGovern | 1997 | 11th |
|
* | 19.4% | |||||||||||||||||||||||||||||||||||||||||||||||||||||||||||||||||||||||||||||||||||||||||||
| MA-3 |  |
Niki Tsongas | 2007 | 6th |
|
37.5% | 22.8% | |||||||||||||||||||||||||||||||||||||||||||||||||||||||||||||||||||||||||||||||||||||||||||
|
Incumbent not running for re-election in 2018.
|
||||||||||||||||||||||||||||||||||||||||||||||||||||||||||||||||||||||||||||||||||||||||||||||||||
| MA-4 |  |
Joseph Kennedy III | 2013 | 3rd |
|
40.3% | 24.2% | |||||||||||||||||||||||||||||||||||||||||||||||||||||||||||||||||||||||||||||||||||||||||||
| MA-5 |  |
Katherine Clark | 2013 | 3rd |
|
* | 43.6% | |||||||||||||||||||||||||||||||||||||||||||||||||||||||||||||||||||||||||||||||||||||||||||
| MA-6 |  |
Seth Moulton | 2015 | 2nd |
|
* | 17.9% | |||||||||||||||||||||||||||||||||||||||||||||||||||||||||||||||||||||||||||||||||||||||||||
| MA-7 |  |
Michael Capuano | 1999 | 10th |
|
* | 72.2% | |||||||||||||||||||||||||||||||||||||||||||||||||||||||||||||||||||||||||||||||||||||||||||
|
Incumbent defeated in primary for 2018 election.
|
||||||||||||||||||||||||||||||||||||||||||||||||||||||||||||||||||||||||||||||||||||||||||||||||||
| MA-8 |  |
Stephen Lynch | 2001 | 9th |
|
45.0% | 26.0% | |||||||||||||||||||||||||||||||||||||||||||||||||||||||||||||||||||||||||||||||||||||||||||
| MA-9 |  |
William Keating | 2011 | 4th |
|
22.1% | 10.7% | |||||||||||||||||||||||||||||||||||||||||||||||||||||||||||||||||||||||||||||||||||||||||||
| MD-1 |  |
Andrew Harris | 2011 | 4th |
|
38.4% | 28.6% | |||||||||||||||||||||||||||||||||||||||||||||||||||||||||||||||||||||||||||||||||||||||||||
| MD-2 |  |
C. A. Dutch Ruppersberger | 2003 | 8th |
|
29.0% | 24.4% | |||||||||||||||||||||||||||||||||||||||||||||||||||||||||||||||||||||||||||||||||||||||||||
| MD-3 |  |
John Sarbanes | 2007 | 6th |
|
29.3% | 30.5% | |||||||||||||||||||||||||||||||||||||||||||||||||||||||||||||||||||||||||||||||||||||||||||
| MD-4 |  |
Anthony Brown | 2017 | 1st |
|
52.7% | 57.5% | |||||||||||||||||||||||||||||||||||||||||||||||||||||||||||||||||||||||||||||||||||||||||||
| MD-5 |  |
Steny Hoyer | 1981 | 19th |
|
38.0% | 32.0% | |||||||||||||||||||||||||||||||||||||||||||||||||||||||||||||||||||||||||||||||||||||||||||
| MD-6 |  |
John Delaney | 2013 | 3rd |
|
15.9% | 15.1% | |||||||||||||||||||||||||||||||||||||||||||||||||||||||||||||||||||||||||||||||||||||||||||
|
Incumbent not running for re-election in 2018.
|
||||||||||||||||||||||||||||||||||||||||||||||||||||||||||||||||||||||||||||||||||||||||||||||||||
| MD-7 |  |
Elijah Cummings | 1996 | 12th |
|
53.1% | 55.6% | |||||||||||||||||||||||||||||||||||||||||||||||||||||||||||||||||||||||||||||||||||||||||||
| MD-8 |  |
Jamie Raskin | 2017 | 1st |
|
26.4% | 34.4% | |||||||||||||||||||||||||||||||||||||||||||||||||||||||||||||||||||||||||||||||||||||||||||
| ME-1 |  |
Chellie Pingree | 2009 | 5th |
|
16.0% | 14.8% | |||||||||||||||||||||||||||||||||||||||||||||||||||||||||||||||||||||||||||||||||||||||||||
| MI-4 | 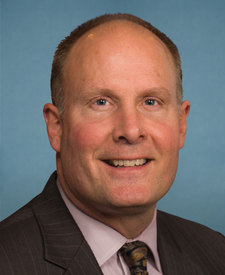 |
John Moolenaar | 2015 | 2nd |
|
29.5% | 24.8% | |||||||||||||||||||||||||||||||||||||||||||||||||||||||||||||||||||||||||||||||||||||||||||
| MI-5 | 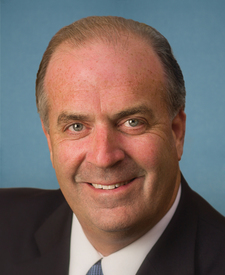 |
Daniel Kildee | 2013 | 3rd |
|
26.1% | 4.2% | |||||||||||||||||||||||||||||||||||||||||||||||||||||||||||||||||||||||||||||||||||||||||||
| MI-9 |  |
Sander Levin | 1983 | 18th |
|
20.5% | 7.8% | |||||||||||||||||||||||||||||||||||||||||||||||||||||||||||||||||||||||||||||||||||||||||||
|
Incumbent not running for re-election in 2018.
|
||||||||||||||||||||||||||||||||||||||||||||||||||||||||||||||||||||||||||||||||||||||||||||||||||
| MI-10 |  |
Paul Mitchell | 2017 | 1st |
|
30.8% | 32.2% | |||||||||||||||||||||||||||||||||||||||||||||||||||||||||||||||||||||||||||||||||||||||||||
| MI-12 |  |
Debbie Dingell | 2015 | 2nd |
|
35.1% | 26.3% | |||||||||||||||||||||||||||||||||||||||||||||||||||||||||||||||||||||||||||||||||||||||||||
| MI-13 |  |
Brenda Jones | 2018 | 1st |
|
61.4% | 60.7% | |||||||||||||||||||||||||||||||||||||||||||||||||||||||||||||||||||||||||||||||||||||||||||
| MI-14 |  |
Brenda Lawrence | 2015 | 2nd |
|
59.8% | 60.9% | |||||||||||||||||||||||||||||||||||||||||||||||||||||||||||||||||||||||||||||||||||||||||||
| MN-4 |  |
Betty McCollum | 2001 | 9th |
|
23.4% | 30.9% | |||||||||||||||||||||||||||||||||||||||||||||||||||||||||||||||||||||||||||||||||||||||||||
| MN-5 |  |
Keith Ellison | 2007 | 6th |
|
46.8% | 55.2% | |||||||||||||||||||||||||||||||||||||||||||||||||||||||||||||||||||||||||||||||||||||||||||
|
Incumbent not running for re-election in 2018.
|
||||||||||||||||||||||||||||||||||||||||||||||||||||||||||||||||||||||||||||||||||||||||||||||||||
| MN-6 |  |
Tom Emmer | 2015 | 2nd |
|
31.3% | 25.7% | |||||||||||||||||||||||||||||||||||||||||||||||||||||||||||||||||||||||||||||||||||||||||||
| MO-1 |  |
William "Lacy" Clay Jr. | 2001 | 9th |
|
55.5% | 58.2% | |||||||||||||||||||||||||||||||||||||||||||||||||||||||||||||||||||||||||||||||||||||||||||
| MO-3 |  |
Blaine Luetkemeyer | 2009 | 5th |
|
39.9% | 39.0% | |||||||||||||||||||||||||||||||||||||||||||||||||||||||||||||||||||||||||||||||||||||||||||
| MO-4 |  |
Vicky Hartzler | 2011 | 4th |
|
40.0% | 36.0% | |||||||||||||||||||||||||||||||||||||||||||||||||||||||||||||||||||||||||||||||||||||||||||
| MO-5 |  |
Emanuel Cleaver | 2005 | 7th |
|
20.7% | 13.5% | |||||||||||||||||||||||||||||||||||||||||||||||||||||||||||||||||||||||||||||||||||||||||||
| MO-6 |  |
Sam Graves | 2001 | 9th |
|
39.6% | 31.4% | |||||||||||||||||||||||||||||||||||||||||||||||||||||||||||||||||||||||||||||||||||||||||||
| MO-7 |  |
Billy Long | 2011 | 4th |
|
40.1% | 45.7% | |||||||||||||||||||||||||||||||||||||||||||||||||||||||||||||||||||||||||||||||||||||||||||
| MO-8 |  |
Jason Smith | 2013 | 3rd |
|
51.7% | 54.4% | |||||||||||||||||||||||||||||||||||||||||||||||||||||||||||||||||||||||||||||||||||||||||||
| MS-1 |  |
Trent Kelly | 2015 | 2nd |
|
40.8% | 33.0% | |||||||||||||||||||||||||||||||||||||||||||||||||||||||||||||||||||||||||||||||||||||||||||
| MS-2 |  |
Bennie Thompson | 1993 | 13th |
|
38.0% | 28.5% | |||||||||||||||||||||||||||||||||||||||||||||||||||||||||||||||||||||||||||||||||||||||||||
| MS-3 |  |
Gregg Harper | 2009 | 5th |
|
35.8% | 24.5% | |||||||||||||||||||||||||||||||||||||||||||||||||||||||||||||||||||||||||||||||||||||||||||
|
Incumbent not running for re-election in 2018.
|
||||||||||||||||||||||||||||||||||||||||||||||||||||||||||||||||||||||||||||||||||||||||||||||||||
| MS-4 |  |
Steven Palazzo | 2011 | 4th |
|
37.2% | 41.2% | |||||||||||||||||||||||||||||||||||||||||||||||||||||||||||||||||||||||||||||||||||||||||||
| NC-1 | 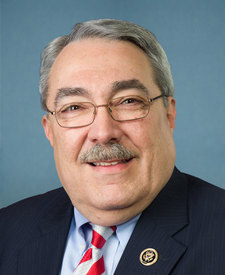 |
G. K. Butterfield | 2004 | 8th |
|
39.7% | 37.0% | |||||||||||||||||||||||||||||||||||||||||||||||||||||||||||||||||||||||||||||||||||||||||||
| NC-3 | 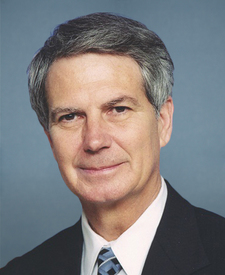 |
Walter Jones | 1995 | 12th |
|
34.4% | 23.6% | |||||||||||||||||||||||||||||||||||||||||||||||||||||||||||||||||||||||||||||||||||||||||||
| NC-4 | 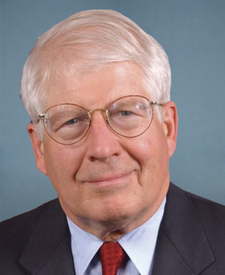 |
David Price | 1997 | 11th |
|
36.4% | 40.0% | |||||||||||||||||||||||||||||||||||||||||||||||||||||||||||||||||||||||||||||||||||||||||||
| NC-5 | 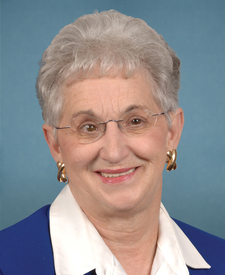 |
Virginia Foxx | 2005 | 7th |
|
16.8% | 17.6% | |||||||||||||||||||||||||||||||||||||||||||||||||||||||||||||||||||||||||||||||||||||||||||
| NC-6 |  |
Mark Walker | 2015 | 2nd |
|
18.5% | 14.7% | |||||||||||||||||||||||||||||||||||||||||||||||||||||||||||||||||||||||||||||||||||||||||||
| NC-7 |  |
David Rouzer | 2015 | 2nd |
|
21.8% | 17.7% | |||||||||||||||||||||||||||||||||||||||||||||||||||||||||||||||||||||||||||||||||||||||||||
| NC-10 |  |
Patrick McHenry | 2005 | 7th |
|
26.3% | 24.6% | |||||||||||||||||||||||||||||||||||||||||||||||||||||||||||||||||||||||||||||||||||||||||||
| NC-11 |  |
Mark Meadows | 2013 | 3rd |
|
28.2% | 29.2% | |||||||||||||||||||||||||||||||||||||||||||||||||||||||||||||||||||||||||||||||||||||||||||
| NC-12 |  |
Alma Adams | 2014 | 3rd |
|
34.0% | 40.0% | |||||||||||||||||||||||||||||||||||||||||||||||||||||||||||||||||||||||||||||||||||||||||||
| ND-AL |  |
Kevin Cramer | 2013 | 3rd |
|
45.4% | 36.4% | |||||||||||||||||||||||||||||||||||||||||||||||||||||||||||||||||||||||||||||||||||||||||||
|
Incumbent not running for re-election in 2018.
|
||||||||||||||||||||||||||||||||||||||||||||||||||||||||||||||||||||||||||||||||||||||||||||||||||
| NE-1 |  |
Jeff Fortenberry | 2005 | 7th |
|
38.9% | 21.3% | |||||||||||||||||||||||||||||||||||||||||||||||||||||||||||||||||||||||||||||||||||||||||||
| NE-3 |  |
Adrian Smith | 2007 | 6th |
|
* | 54.9% | |||||||||||||||||||||||||||||||||||||||||||||||||||||||||||||||||||||||||||||||||||||||||||
| NH-2 |  |
Ann Kuster | 2013 | 3rd |
|
4.4% | 2.4% | |||||||||||||||||||||||||||||||||||||||||||||||||||||||||||||||||||||||||||||||||||||||||||
| NJ-1 |  |
Donald Norcross | 2014 | 3rd |
|
23.2% | 24.5% | |||||||||||||||||||||||||||||||||||||||||||||||||||||||||||||||||||||||||||||||||||||||||||
| NJ-4 |  |
Christopher Smith | 1981 | 19th |
|
30.2% | 14.8% | |||||||||||||||||||||||||||||||||||||||||||||||||||||||||||||||||||||||||||||||||||||||||||
| NJ-6 |  |
Frank Pallone | 1988 | 16th |
|
28.8% | 15.6% | |||||||||||||||||||||||||||||||||||||||||||||||||||||||||||||||||||||||||||||||||||||||||||
| NJ-8 |  |
Albio Sires | 2006 | 7th |
|
58.5% | 54.2% | |||||||||||||||||||||||||||||||||||||||||||||||||||||||||||||||||||||||||||||||||||||||||||
| NJ-9 |  |
Bill Jr. Pascrell | 1997 | 11th |
|
41.7% | 31.2% | |||||||||||||||||||||||||||||||||||||||||||||||||||||||||||||||||||||||||||||||||||||||||||
| NJ-10 |  |
Donald Payne Jr. | 2012 | 4th |
|
73.8% | 72.4% | |||||||||||||||||||||||||||||||||||||||||||||||||||||||||||||||||||||||||||||||||||||||||||
| NJ-12 |  |
Bonnie Coleman | 2015 | 2nd |
|
30.8% | 33.2% | |||||||||||||||||||||||||||||||||||||||||||||||||||||||||||||||||||||||||||||||||||||||||||
| NM-1 |  |
Michelle Lujan Grisham | 2013 | 3rd |
|
30.3% | 16.5% | |||||||||||||||||||||||||||||||||||||||||||||||||||||||||||||||||||||||||||||||||||||||||||
|
Incumbent not running for re-election in 2018.
|
||||||||||||||||||||||||||||||||||||||||||||||||||||||||||||||||||||||||||||||||||||||||||||||||||
| NM-3 |  |
Ben Ray Lujan | 2009 | 5th |
|
24.8% | 15.1% | |||||||||||||||||||||||||||||||||||||||||||||||||||||||||||||||||||||||||||||||||||||||||||
| NV-1 |  |
Dina Titus | 2013 | 3rd |
|
33.1% | 29.0% | |||||||||||||||||||||||||||||||||||||||||||||||||||||||||||||||||||||||||||||||||||||||||||
| NV-2 |  |
Marc Amodei | 2011 | 4th |
|
21.4% | 12.3% | |||||||||||||||||||||||||||||||||||||||||||||||||||||||||||||||||||||||||||||||||||||||||||
| NY-3 | 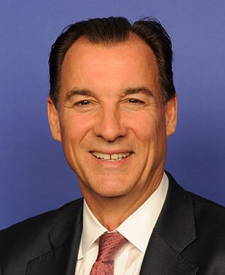 |
Thomas Suozzi | 2017 | 1st |
|
5.6% | 6.1% | |||||||||||||||||||||||||||||||||||||||||||||||||||||||||||||||||||||||||||||||||||||||||||
| NY-4 |  |
Kathleen Rice | 2015 | 2nd |
|
19.1% | 9.6% | |||||||||||||||||||||||||||||||||||||||||||||||||||||||||||||||||||||||||||||||||||||||||||
| NY-5 |  |
Gregory Meeks | 1998 | 11th |
|
72.5% | 73.0% | |||||||||||||||||||||||||||||||||||||||||||||||||||||||||||||||||||||||||||||||||||||||||||
| NY-6 |  |
Grace Meng | 2013 | 3rd |
|
45.4% | 33.0% | |||||||||||||||||||||||||||||||||||||||||||||||||||||||||||||||||||||||||||||||||||||||||||
| NY-7 |  |
Nydia Velazquez | 1993 | 13th |
|
81.6% | 76.5% | |||||||||||||||||||||||||||||||||||||||||||||||||||||||||||||||||||||||||||||||||||||||||||
| NY-8 |  |
Hakeem Jeffries | 2013 | 3rd |
|
86.6% | 71.1% | |||||||||||||||||||||||||||||||||||||||||||||||||||||||||||||||||||||||||||||||||||||||||||
| NY-9 |  |
Yvette Clarke | 2007 | 6th |
|
84.8% | 69.1% | |||||||||||||||||||||||||||||||||||||||||||||||||||||||||||||||||||||||||||||||||||||||||||
| NY-10 |  |
Jerrold Nadler | 1992 | 14th |
|
56.2% | 59.5% | |||||||||||||||||||||||||||||||||||||||||||||||||||||||||||||||||||||||||||||||||||||||||||
| NY-12 |  |
Carolyn Maloney | 1993 | 13th |
|
66.4% | 69.8% | |||||||||||||||||||||||||||||||||||||||||||||||||||||||||||||||||||||||||||||||||||||||||||
| NY-13 |  |
Adriano Espaillat | 2017 | 1st |
|
81.9% | 86.9% | |||||||||||||||||||||||||||||||||||||||||||||||||||||||||||||||||||||||||||||||||||||||||||
| NY-14 |  |
Joseph Crowley | 1999 | 10th |
|
65.7% | 57.9% | |||||||||||||||||||||||||||||||||||||||||||||||||||||||||||||||||||||||||||||||||||||||||||
|
Incumbent defeated in primary for 2018 election.
|
||||||||||||||||||||||||||||||||||||||||||||||||||||||||||||||||||||||||||||||||||||||||||||||||||
| NY-15 |  |
Jose Serrano | 1990 | 15th |
|
91.7% | 88.9% | |||||||||||||||||||||||||||||||||||||||||||||||||||||||||||||||||||||||||||||||||||||||||||
| NY-16 |  |
Eliot Engel | 1989 | 15th |
|
89.3% | 52.6% | |||||||||||||||||||||||||||||||||||||||||||||||||||||||||||||||||||||||||||||||||||||||||||
| NY-17 |  |
Nita Lowey | 1989 | 15th |
|
* | 20.2% | |||||||||||||||||||||||||||||||||||||||||||||||||||||||||||||||||||||||||||||||||||||||||||
| NY-20 |  |
Paul Tonko | 2009 | 5th |
|
35.8% | 13.5% | |||||||||||||||||||||||||||||||||||||||||||||||||||||||||||||||||||||||||||||||||||||||||||
| NY-25 |  |
Joe Morelle | 2018 | 1st |
|
12.4% | 16.4% | |||||||||||||||||||||||||||||||||||||||||||||||||||||||||||||||||||||||||||||||||||||||||||
| NY-26 |  |
Brian Higgins | 2005 | 7th |
|
49.2% | 19.6% | |||||||||||||||||||||||||||||||||||||||||||||||||||||||||||||||||||||||||||||||||||||||||||
| OH-2 | 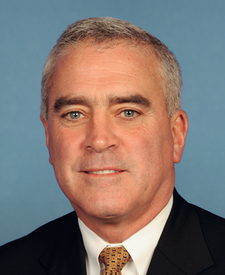 |
Brad Wenstrup | 2013 | 3rd |
|
32.2% | 16.1% | |||||||||||||||||||||||||||||||||||||||||||||||||||||||||||||||||||||||||||||||||||||||||||
| OH-3 | 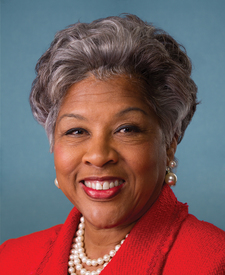 |
Joyce Beatty | 2013 | 3rd |
|
37.1% | 38.4% | |||||||||||||||||||||||||||||||||||||||||||||||||||||||||||||||||||||||||||||||||||||||||||
| OH-4 | 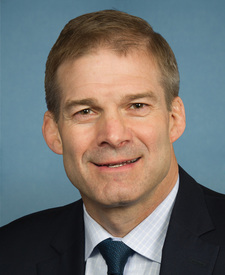 |
Jim Jordan | 2007 | 6th |
|
36.0% | 33.6% | |||||||||||||||||||||||||||||||||||||||||||||||||||||||||||||||||||||||||||||||||||||||||||
| OH-5 |  |
Robert Latta | 2007 | 6th |
|
41.8% | 25.1% | |||||||||||||||||||||||||||||||||||||||||||||||||||||||||||||||||||||||||||||||||||||||||||
| OH-6 |  |
Bill Johnson | 2011 | 4th |
|
41.4% | 42.6% | |||||||||||||||||||||||||||||||||||||||||||||||||||||||||||||||||||||||||||||||||||||||||||
| OH-8 |  |
Warren Davidson | 2016 | 2nd |
|
41.8% | 34.5% | |||||||||||||||||||||||||||||||||||||||||||||||||||||||||||||||||||||||||||||||||||||||||||
| OH-9 |  |
Marcy Kaptur | 1983 | 18th |
|
37.4% | 22.2% | |||||||||||||||||||||||||||||||||||||||||||||||||||||||||||||||||||||||||||||||||||||||||||
| OH-11 |  |
Marcia Fudge | 2008 | 6th |
|
60.5% | 63.5% | |||||||||||||||||||||||||||||||||||||||||||||||||||||||||||||||||||||||||||||||||||||||||||
| OH-13 |  |
Tim Ryan | 2003 | 8th |
|
35.5% | 6.5% | |||||||||||||||||||||||||||||||||||||||||||||||||||||||||||||||||||||||||||||||||||||||||||
| OH-16 |  |
Jim Renacci | 2011 | 4th |
|
30.7% | 16.6% | |||||||||||||||||||||||||||||||||||||||||||||||||||||||||||||||||||||||||||||||||||||||||||
|
Incumbent not running for re-election in 2018.
|
||||||||||||||||||||||||||||||||||||||||||||||||||||||||||||||||||||||||||||||||||||||||||||||||||
| OK-1 |  |
Kevin Hern | 2018 | 1st |
|
* | 28.7% | |||||||||||||||||||||||||||||||||||||||||||||||||||||||||||||||||||||||||||||||||||||||||||
| OK-2 |  |
Markwayne Mullin | 2013 | 3rd |
|
47.4% | 50.1% | |||||||||||||||||||||||||||||||||||||||||||||||||||||||||||||||||||||||||||||||||||||||||||
| OK-3 |  |
Frank Lucas | 1994 | 13th |
|
56.6% | 52.7% | |||||||||||||||||||||||||||||||||||||||||||||||||||||||||||||||||||||||||||||||||||||||||||
| OK-4 |  |
Tom Cole | 2003 | 8th |
|
43.5% | 37.4% | |||||||||||||||||||||||||||||||||||||||||||||||||||||||||||||||||||||||||||||||||||||||||||
| OR-1 |  |
Suzanne Bonamici | 2012 | 4th |
|
22.6% | 22.8% | |||||||||||||||||||||||||||||||||||||||||||||||||||||||||||||||||||||||||||||||||||||||||||
| OR-2 |  |
Greg Walden | 1999 | 10th |
|
43.7% | 20.1% | |||||||||||||||||||||||||||||||||||||||||||||||||||||||||||||||||||||||||||||||||||||||||||
| OR-3 |  |
Earl Blumenauer | 1996 | 12th |
|
51.4% | 48.2% | |||||||||||||||||||||||||||||||||||||||||||||||||||||||||||||||||||||||||||||||||||||||||||
| OR-4 |  |
Peter DeFazio | 1987 | 16th |
|
15.8% | 0.1% | |||||||||||||||||||||||||||||||||||||||||||||||||||||||||||||||||||||||||||||||||||||||||||
| OR-5 | 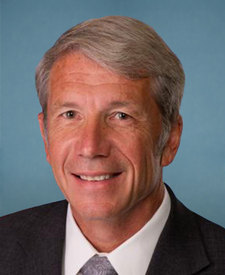 |
Kurt Schrader | 2009 | 5th |
|
10.5% | 4.2% | |||||||||||||||||||||||||||||||||||||||||||||||||||||||||||||||||||||||||||||||||||||||||||
| PA-2 |  |
Brendan Boyle | 2015 | 2nd |
|
N/A | 48.0% | |||||||||||||||||||||||||||||||||||||||||||||||||||||||||||||||||||||||||||||||||||||||||||
|
Redrawn PA-2 is about 50% current PA-13 (Boyle), 40% current PA-1 (Brady, retiring)
|
||||||||||||||||||||||||||||||||||||||||||||||||||||||||||||||||||||||||||||||||||||||||||||||||||
| PA-3 |  |
Dwight Evans | 2016 | 2nd |
|
N/A | 83.9% | |||||||||||||||||||||||||||||||||||||||||||||||||||||||||||||||||||||||||||||||||||||||||||
|
Redrawn PA-3 is mostly current PA-2 (Evans)
|
||||||||||||||||||||||||||||||||||||||||||||||||||||||||||||||||||||||||||||||||||||||||||||||||||
| PA-4 |  |
(OPEN) Safe Democratic |
|
N/A | 19.4% | |||||||||||||||||||||||||||||||||||||||||||||||||||||||||||||||||||||||||||||||||||||||||||||
|
Redrawn PA-4 is split between several districts. No incumbent running for this safe Democratic seat
|
||||||||||||||||||||||||||||||||||||||||||||||||||||||||||||||||||||||||||||||||||||||||||||||||||
| PA-9 |  |
(OPEN) Safe Republican |
|
N/A | 34.0% | |||||||||||||||||||||||||||||||||||||||||||||||||||||||||||||||||||||||||||||||||||||||||||||
|
Redrawn PA-9 is split between several districts. No incumbent running for this safe Republican seat.
|
||||||||||||||||||||||||||||||||||||||||||||||||||||||||||||||||||||||||||||||||||||||||||||||||||
| PA-11 |  |
Lloyd Smucker | 2017 | 1st |
|
N/A | 25.8% | |||||||||||||||||||||||||||||||||||||||||||||||||||||||||||||||||||||||||||||||||||||||||||
|
Redrawn PA-11 is majority current PA-16 (Smucker)
|
||||||||||||||||||||||||||||||||||||||||||||||||||||||||||||||||||||||||||||||||||||||||||||||||||
| PA-12 |  |
Tom Marino | 2011 | 4th |
|
N/A | 36.5% | |||||||||||||||||||||||||||||||||||||||||||||||||||||||||||||||||||||||||||||||||||||||||||
|
Redrawn PA-12 is majority current PA-10 (Marino)
|
||||||||||||||||||||||||||||||||||||||||||||||||||||||||||||||||||||||||||||||||||||||||||||||||||
| PA-13 |  |
Bill Shuster | 2001 | 9th |
|
N/A | 45.5% | |||||||||||||||||||||||||||||||||||||||||||||||||||||||||||||||||||||||||||||||||||||||||||
|
Redrawn PA-13 is about 50% current PA-9 (Shuster, retiring)
|
||||||||||||||||||||||||||||||||||||||||||||||||||||||||||||||||||||||||||||||||||||||||||||||||||
| PA-15 |  |
Glenn Thompson | 2009 | 5th |
|
N/A | 43.4% | |||||||||||||||||||||||||||||||||||||||||||||||||||||||||||||||||||||||||||||||||||||||||||
|
Redrawn PA-15 is majority current PA-5 (Thompson)
|
||||||||||||||||||||||||||||||||||||||||||||||||||||||||||||||||||||||||||||||||||||||||||||||||||
| PA-18 |  |
Michael Doyle | 1995 | 12th |
|
N/A | 26.8% | |||||||||||||||||||||||||||||||||||||||||||||||||||||||||||||||||||||||||||||||||||||||||||
|
Redrawn PA-18 is mostly current PA-14 (Doyle)
|
||||||||||||||||||||||||||||||||||||||||||||||||||||||||||||||||||||||||||||||||||||||||||||||||||
| RI-1 |  |
David Cicilline | 2011 | 4th |
|
29.4% | 25.6% | |||||||||||||||||||||||||||||||||||||||||||||||||||||||||||||||||||||||||||||||||||||||||||
| RI-2 |  |
James Langevin | 2001 | 9th |
|
27.4% | 7.1% | |||||||||||||||||||||||||||||||||||||||||||||||||||||||||||||||||||||||||||||||||||||||||||
| SC-2 |  |
Joe Wilson | 2001 | 9th |
|
24.4% | 17.7% | |||||||||||||||||||||||||||||||||||||||||||||||||||||||||||||||||||||||||||||||||||||||||||
| SC-3 |  |
Jeff Duncan | 2011 | 4th |
|
45.8% | 38.0% | |||||||||||||||||||||||||||||||||||||||||||||||||||||||||||||||||||||||||||||||||||||||||||
| SC-4 |  |
Trey Gowdy | 2011 | 4th |
|
36.2% | 25.7% | |||||||||||||||||||||||||||||||||||||||||||||||||||||||||||||||||||||||||||||||||||||||||||
|
Incumbent not running for re-election in 2018.
|
||||||||||||||||||||||||||||||||||||||||||||||||||||||||||||||||||||||||||||||||||||||||||||||||||
| SC-5 |  |
Ralph Norman | 2017 | 1st |
|
20.5% | 18.5% | |||||||||||||||||||||||||||||||||||||||||||||||||||||||||||||||||||||||||||||||||||||||||||
| SC-6 |  |
James Clyburn | 1993 | 13th |
|
42.5% | 36.5% | |||||||||||||||||||||||||||||||||||||||||||||||||||||||||||||||||||||||||||||||||||||||||||
| SC-7 |  |
Tom Rice | 2013 | 3rd |
|
22.0% | 18.9% | |||||||||||||||||||||||||||||||||||||||||||||||||||||||||||||||||||||||||||||||||||||||||||
| SD-AL |  |
Kristi Noem | 2011 | 4th |
|
28.2% | 29.8% | |||||||||||||||||||||||||||||||||||||||||||||||||||||||||||||||||||||||||||||||||||||||||||
|
Incumbent not running for re-election in 2018.
|
||||||||||||||||||||||||||||||||||||||||||||||||||||||||||||||||||||||||||||||||||||||||||||||||||
| TN-1 | 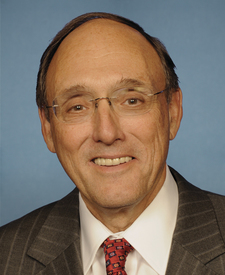 |
Phil Roe | 2009 | 5th |
|
62.9% | 57.0% | |||||||||||||||||||||||||||||||||||||||||||||||||||||||||||||||||||||||||||||||||||||||||||
| TN-2 | 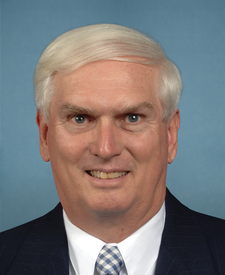 |
John J. Duncan Jr. | 1988 | 16th |
|
51.3% | 35.4% | |||||||||||||||||||||||||||||||||||||||||||||||||||||||||||||||||||||||||||||||||||||||||||
|
Incumbent not running for re-election in 2018.
|
||||||||||||||||||||||||||||||||||||||||||||||||||||||||||||||||||||||||||||||||||||||||||||||||||
| TN-3 | 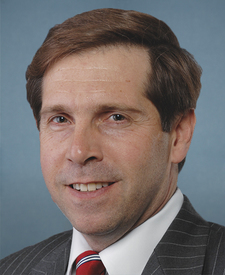 |
Chuck Fleischmann | 2011 | 4th |
|
37.6% | 35.2% | |||||||||||||||||||||||||||||||||||||||||||||||||||||||||||||||||||||||||||||||||||||||||||
| TN-4 | 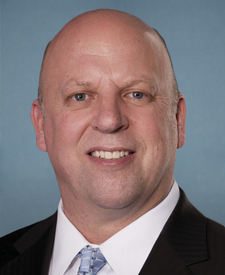 |
Scott DesJarlais | 2011 | 4th |
|
30.1% | 41.2% | |||||||||||||||||||||||||||||||||||||||||||||||||||||||||||||||||||||||||||||||||||||||||||
| TN-5 | 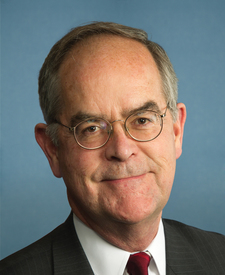 |
Jim Cooper | 2003 | 8th |
|
25.1% | 18.4% | |||||||||||||||||||||||||||||||||||||||||||||||||||||||||||||||||||||||||||||||||||||||||||
| TN-6 | 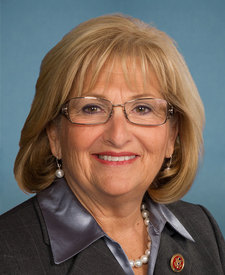 |
Diane Black | 2011 | 4th |
|
49.3% | 48.9% | |||||||||||||||||||||||||||||||||||||||||||||||||||||||||||||||||||||||||||||||||||||||||||
|
Incumbent not running for re-election in 2018.
|
||||||||||||||||||||||||||||||||||||||||||||||||||||||||||||||||||||||||||||||||||||||||||||||||||
| TN-7 | 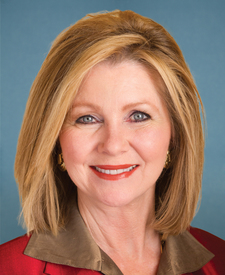 |
Marsha Blackburn | 2003 | 8th |
|
48.7% | 39.3% | |||||||||||||||||||||||||||||||||||||||||||||||||||||||||||||||||||||||||||||||||||||||||||
|
Incumbent not running for re-election in 2018.
|
||||||||||||||||||||||||||||||||||||||||||||||||||||||||||||||||||||||||||||||||||||||||||||||||||
| TN-8 |  |
David Kustoff | 2017 | 1st |
|
43.7% | 35.6% | |||||||||||||||||||||||||||||||||||||||||||||||||||||||||||||||||||||||||||||||||||||||||||
| TN-9 |  |
Steve Cohen | 2007 | 6th |
|
59.9% | 57.7% | |||||||||||||||||||||||||||||||||||||||||||||||||||||||||||||||||||||||||||||||||||||||||||
| TX-1 |  |
Louie Gohmert | 2005 | 7th |
|
49.8% | 46.9% | |||||||||||||||||||||||||||||||||||||||||||||||||||||||||||||||||||||||||||||||||||||||||||
| TX-3 |  |
Sam Johnson | 1991 | 14th |
|
26.6% | 14.2% | |||||||||||||||||||||||||||||||||||||||||||||||||||||||||||||||||||||||||||||||||||||||||||
|
Incumbent not running for re-election in 2018.
|
||||||||||||||||||||||||||||||||||||||||||||||||||||||||||||||||||||||||||||||||||||||||||||||||||
| TX-4 |  |
John Ratcliffe | 2015 | 2nd |
|
76.0% | 53.6% | |||||||||||||||||||||||||||||||||||||||||||||||||||||||||||||||||||||||||||||||||||||||||||
| TX-5 |  |
Jeb Hensarling | 2003 | 8th |
|
61.2% | 28.4% | |||||||||||||||||||||||||||||||||||||||||||||||||||||||||||||||||||||||||||||||||||||||||||
|
Incumbent not running for re-election in 2018.
|
||||||||||||||||||||||||||||||||||||||||||||||||||||||||||||||||||||||||||||||||||||||||||||||||||
| TX-8 |  |
Kevin Brady | 1997 | 11th |
|
* | 48.8% | |||||||||||||||||||||||||||||||||||||||||||||||||||||||||||||||||||||||||||||||||||||||||||
| TX-9 |  |
Al Green | 2005 | 7th |
|
54.8% | 61.3% | |||||||||||||||||||||||||||||||||||||||||||||||||||||||||||||||||||||||||||||||||||||||||||
| TX-11 |  |
K. Michael Conaway | 2005 | 7th |
|
79.0% | 58.7% | |||||||||||||||||||||||||||||||||||||||||||||||||||||||||||||||||||||||||||||||||||||||||||
| TX-12 |  |
Kay Granger | 1997 | 11th |
|
42.5% | 30.2% | |||||||||||||||||||||||||||||||||||||||||||||||||||||||||||||||||||||||||||||||||||||||||||
| TX-13 |  |
Mac Thornberry | 1995 | 12th |
|
83.3% | 63.0% | |||||||||||||||||||||||||||||||||||||||||||||||||||||||||||||||||||||||||||||||||||||||||||
| TX-14 |  |
Randy Weber | 2013 | 3rd |
|
23.7% | 19.8% | |||||||||||||||||||||||||||||||||||||||||||||||||||||||||||||||||||||||||||||||||||||||||||
| TX-15 |  |
Vicente Gonzalez | 2017 | 1st |
|
19.6% | 16.7% | |||||||||||||||||||||||||||||||||||||||||||||||||||||||||||||||||||||||||||||||||||||||||||
| TX-16 |  |
Beto O'Rourke | 2013 | 3rd |
|
75.8% | 40.7% | |||||||||||||||||||||||||||||||||||||||||||||||||||||||||||||||||||||||||||||||||||||||||||
|
Incumbent not running for re-election in 2018.
|
||||||||||||||||||||||||||||||||||||||||||||||||||||||||||||||||||||||||||||||||||||||||||||||||||
| TX-17 |  |
Bill Flores | 2011 | 4th |
|
25.6% | 17.5% | |||||||||||||||||||||||||||||||||||||||||||||||||||||||||||||||||||||||||||||||||||||||||||
| TX-18 |  |
Sheila Jackson-Lee | 1995 | 12th |
|
49.9% | 56.5% | |||||||||||||||||||||||||||||||||||||||||||||||||||||||||||||||||||||||||||||||||||||||||||
| TX-19 |  |
Jodey Arrington | 2017 | 1st |
|
78.1% | 49.0% | |||||||||||||||||||||||||||||||||||||||||||||||||||||||||||||||||||||||||||||||||||||||||||
| TX-20 |  |
Joaquin Castro | 2013 | 3rd |
|
64.3% | 26.7% | |||||||||||||||||||||||||||||||||||||||||||||||||||||||||||||||||||||||||||||||||||||||||||
| TX-25 |  |
Roger Williams | 2013 | 3rd |
|
20.6% | 14.9% | |||||||||||||||||||||||||||||||||||||||||||||||||||||||||||||||||||||||||||||||||||||||||||
| TX-26 |  |
Michael Burgess | 2003 | 8th |
|
36.7% | 26.5% | |||||||||||||||||||||||||||||||||||||||||||||||||||||||||||||||||||||||||||||||||||||||||||
| TX-27 |  |
Michael Cloud | 2018 | 1st |
|
23.4% | 23.6% | |||||||||||||||||||||||||||||||||||||||||||||||||||||||||||||||||||||||||||||||||||||||||||
| TX-28 |  |
Henry Cuellar | 2005 | 7th |
|
34.9% | 19.8% | |||||||||||||||||||||||||||||||||||||||||||||||||||||||||||||||||||||||||||||||||||||||||||
| TX-29 |  |
Gene Green | 1993 | 13th |
|
48.5% | 45.7% | |||||||||||||||||||||||||||||||||||||||||||||||||||||||||||||||||||||||||||||||||||||||||||
|
Incumbent not running for re-election in 2018.
|
||||||||||||||||||||||||||||||||||||||||||||||||||||||||||||||||||||||||||||||||||||||||||||||||||
| TX-30 |  |
Eddie Johnson | 1993 | 13th |
|
58.9% | 60.8% | |||||||||||||||||||||||||||||||||||||||||||||||||||||||||||||||||||||||||||||||||||||||||||
| TX-33 |  |
Marc Veasey | 2013 | 3rd |
|
47.4% | 49.2% | |||||||||||||||||||||||||||||||||||||||||||||||||||||||||||||||||||||||||||||||||||||||||||
| TX-34 |  |
Filemon Vela | 2013 | 3rd |
|
25.3% | 21.5% | |||||||||||||||||||||||||||||||||||||||||||||||||||||||||||||||||||||||||||||||||||||||||||
| TX-35 |  |
Lloyd Doggett | 1995 | 12th |
|
31.5% | 33.6% | |||||||||||||||||||||||||||||||||||||||||||||||||||||||||||||||||||||||||||||||||||||||||||
| TX-36 |  |
Brian Babin | 2015 | 2nd |
|
77.2% | 46.8% | |||||||||||||||||||||||||||||||||||||||||||||||||||||||||||||||||||||||||||||||||||||||||||
| UT-1 |  |
Rob Bishop | 2003 | 8th |
|
39.5% | 27.3% | |||||||||||||||||||||||||||||||||||||||||||||||||||||||||||||||||||||||||||||||||||||||||||
| UT-2 |  |
Chris Stewart | 2013 | 3rd |
|
27.7% | 14.0% | |||||||||||||||||||||||||||||||||||||||||||||||||||||||||||||||||||||||||||||||||||||||||||
| UT-3 |  |
John Curtis | 2017 | 1st |
|
46.9% | 23.9% | |||||||||||||||||||||||||||||||||||||||||||||||||||||||||||||||||||||||||||||||||||||||||||
| VA-1 |  |
Robert Wittman | 2007 | 6th |
|
23.3% | 12.4% | |||||||||||||||||||||||||||||||||||||||||||||||||||||||||||||||||||||||||||||||||||||||||||
| VA-3 |  |
Robert Scott | 1993 | 13th |
|
33.6% | 31.7% | |||||||||||||||||||||||||||||||||||||||||||||||||||||||||||||||||||||||||||||||||||||||||||
| VA-4 |  |
Donald McEachin | 2017 | 1st |
|
15.7% | 21.6% | |||||||||||||||||||||||||||||||||||||||||||||||||||||||||||||||||||||||||||||||||||||||||||
| VA-6 |  |
Bob Goodlatte | 1993 | 13th |
|
33.5% | 24.8% | |||||||||||||||||||||||||||||||||||||||||||||||||||||||||||||||||||||||||||||||||||||||||||
|
Incumbent not running for re-election in 2018.
|
||||||||||||||||||||||||||||||||||||||||||||||||||||||||||||||||||||||||||||||||||||||||||||||||||
| VA-8 |  |
Donald Beyer | 2015 | 2nd |
|
41.1% | 52.6% | |||||||||||||||||||||||||||||||||||||||||||||||||||||||||||||||||||||||||||||||||||||||||||
| VA-9 |  |
Morgan Griffith | 2011 | 4th |
|
40.3% | 41.5% | |||||||||||||||||||||||||||||||||||||||||||||||||||||||||||||||||||||||||||||||||||||||||||
| VA-11 |  |
Gerald Connolly | 2009 | 5th |
|
* | 39.4% | |||||||||||||||||||||||||||||||||||||||||||||||||||||||||||||||||||||||||||||||||||||||||||
| VT-AL |  |
Peter Welch | 2007 | 6th |
|
79.6% | 26.4% | |||||||||||||||||||||||||||||||||||||||||||||||||||||||||||||||||||||||||||||||||||||||||||
| WA-1 |  |
Suzan DelBene | 2012 | 4th |
|
10.8% | 16.3% | |||||||||||||||||||||||||||||||||||||||||||||||||||||||||||||||||||||||||||||||||||||||||||
| WA-2 |  |
Rick Larsen | 2001 | 9th |
|
28.0% | 22.1% | |||||||||||||||||||||||||||||||||||||||||||||||||||||||||||||||||||||||||||||||||||||||||||
| WA-4 |  |
Dan Newhouse | 2015 | 2nd |
|
15.3% ^ | 22.8% | |||||||||||||||||||||||||||||||||||||||||||||||||||||||||||||||||||||||||||||||||||||||||||
| WA-6 |  |
Derek Kilmer | 2013 | 3rd |
|
23.1% | 12.3% | |||||||||||||||||||||||||||||||||||||||||||||||||||||||||||||||||||||||||||||||||||||||||||
| WA-7 |  |
Pramila Jayapal | 2017 | 1st |
|
12.0% ^ | 69.9% | |||||||||||||||||||||||||||||||||||||||||||||||||||||||||||||||||||||||||||||||||||||||||||
| WA-9 |  |
Adam Smith | 1997 | 11th |
|
45.8% | 47.2% | |||||||||||||||||||||||||||||||||||||||||||||||||||||||||||||||||||||||||||||||||||||||||||
| WA-10 |  |
Denny Heck | 2013 | 3rd |
|
17.3% | 11.4% | |||||||||||||||||||||||||||||||||||||||||||||||||||||||||||||||||||||||||||||||||||||||||||
| WI-2 |  |
Mark Pocan | 2013 | 3rd |
|
37.6% | 36.8% | |||||||||||||||||||||||||||||||||||||||||||||||||||||||||||||||||||||||||||||||||||||||||||
| WI-3 |  |
Ron Kind | 1997 | 11th |
|
* | 4.5% | |||||||||||||||||||||||||||||||||||||||||||||||||||||||||||||||||||||||||||||||||||||||||||
| WI-4 |  |
Gwen Moore | 2005 | 7th |
|
65.3% | 52.2% | |||||||||||||||||||||||||||||||||||||||||||||||||||||||||||||||||||||||||||||||||||||||||||
| WI-5 |  |
Jim Sensenbrenner | 1979 | 20th |
|
37.4% | 20.1% | |||||||||||||||||||||||||||||||||||||||||||||||||||||||||||||||||||||||||||||||||||||||||||
| WI-7 |  |
Sean Duffy | 2011 | 4th |
|
23.4% | 20.5% | |||||||||||||||||||||||||||||||||||||||||||||||||||||||||||||||||||||||||||||||||||||||||||
| WI-8 |  |
Mike Gallagher | 2017 | 1st |
|
25.4% | 17.6% | |||||||||||||||||||||||||||||||||||||||||||||||||||||||||||||||||||||||||||||||||||||||||||
| WV-1 |  |
David McKinley | 2011 | 4th |
|
37.9% | 41.6% | |||||||||||||||||||||||||||||||||||||||||||||||||||||||||||||||||||||||||||||||||||||||||||
| WY-AL |  |
Liz Cheney | 2017 | 1st |
|
32.1% | 47.6% | |||||||||||||||||||||||||||||||||||||||||||||||||||||||||||||||||||||||||||||||||||||||||||
(a)Source: Ballotpedia (for margins). The margin is the percentage difference between the top two vote-getters in 2016.
More recent results (i.e., special elections held in 2017-18 for vacancies) are not displayed.
* Race was uncontested | ^Top two vote-getters were from the same party
(b)Source: Daily Kos. The margin is the percentage difference between Donald Trump and Hillary Clinton.


Customize your map by changing one or more districts. Return here to share it. Share or Embed your Map: Select 'Share Map' button above. Share or Embed your Map: