Maryland 2024 Presidential Election Polls
Biden vs. Trump
| Source | Date | Sample | Biden | Trump | Other | |
|---|---|---|---|---|---|---|
| Emerson College | 5/09/2024 | 1,115 RV ±2.9% | 56% | 35% | 9% | |
| Emerson College | 2/15/2024 | 1,000 RV ±3% | 55% | 32% | 13% | |
| Gonzales Research & Media | 2/14/2024 | 815 LV ±3.5% | 53% | 32% | 15% | |
| Gonzales Research & Media | 10/04/2023 | 818 LV ±3.5% | 56% | 30% | 14% | |
| Gonzales Research & Media | 6/14/2023 | 841 RV ±3.5% | 52% | 35% | 13% | |
Including Third Parties and Independents
A separate average calculation for the subset of polls that have a question that names one or more notable candidates in addition to Biden and Trump. The inclusion of these names can significantly influence the polling average.
| Source | Date | Sample | Biden | Stein | Kennedy | West | Trump | Other | |
|---|---|---|---|---|---|---|---|---|---|
| Emerson College | 5/09/2024 | 1,115 RV ±2.9% | 50% | 1% | 6% | 3% | 33% | 7% | |
| Emerson College | 2/15/2024 | 1,000 RV ±3% | 47% | 1% | 6% | 1% | 31% | 14% | |
| Gonzales Research & Media | 2/14/2024 | 815 LV ±3.5% | 45% | - | 9% | - | 28% | 18% | |
When did it last happen?
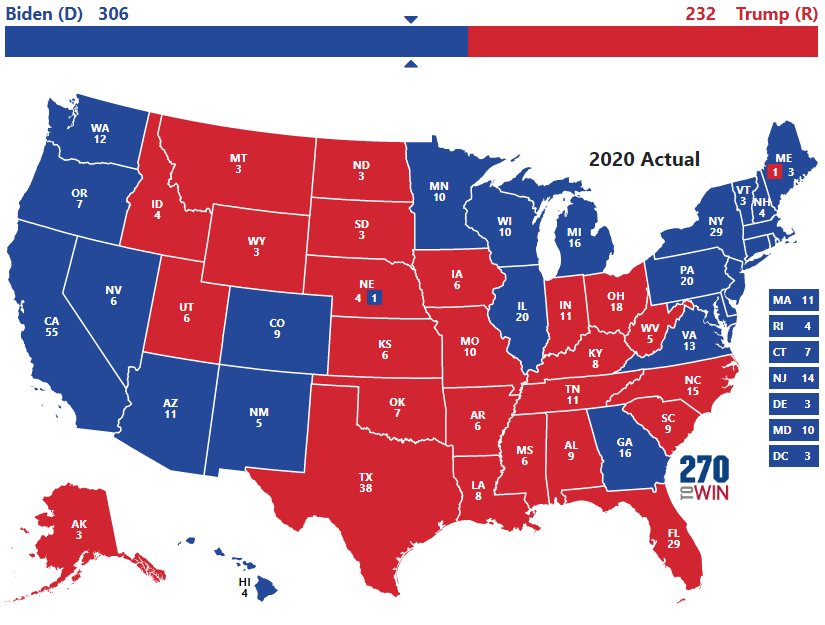
This feature shows the most recent election where the state voted with or against the presidential winner in each party. Click the year to see the corresponding electoral map and results.Maryland Winner
Biden
Clinton
Bush
Dewey
Election Winner
Biden
Trump
Bush
Truman
2020
2016
1988
1948