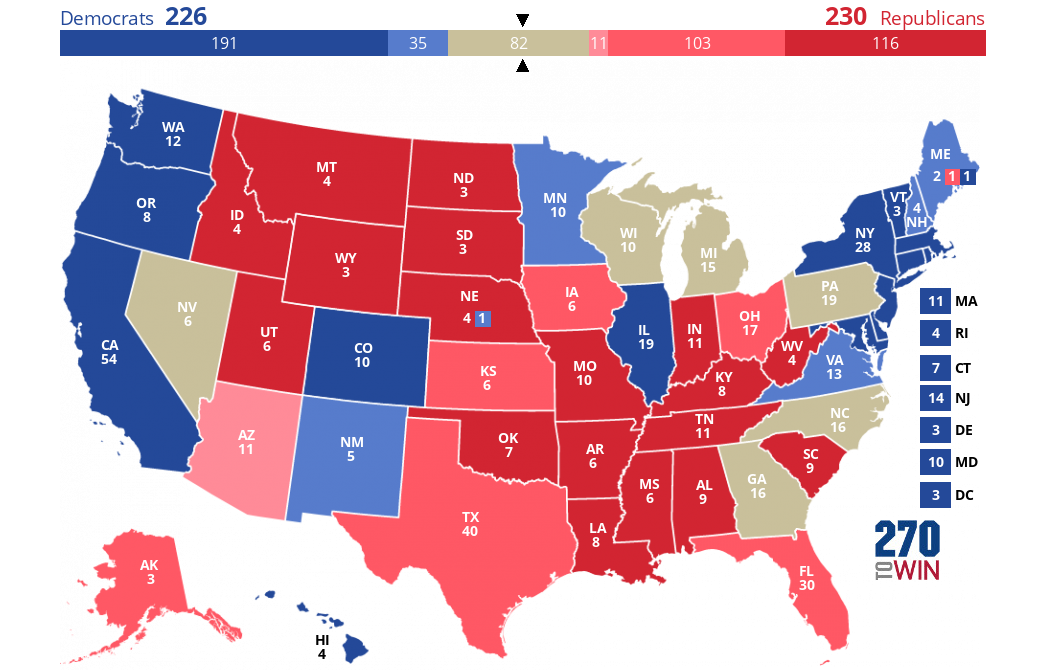
2012 Presidential Election Actual Results
This isn’t a popularity contest™
This map shows the allocation of electoral votes in the 2012 presidential election. Use it as a starting point to create and share your 2020 forecast.
If you'd like to change history, visit the 2012 election historical interactive map.

VT |
|
NH |
|
MA |
|
RI |
|
CT |
|
NJ |
|
DE |
|
MD |
|
DC |

Map :
Headlines
Cook Political Report Introduces 2026 Governor Ratings
36 states will hold elections next year; the forecaster sees five toss-ups with their initial ratings
Live Results: South Carolina State House District 113 Special Primary
Three Democrats are vying to replace former Rep. Marvin Pendarvis, who resigned this past September.
Minnesota State Senate Special Primary: Overview and Live Results
The primary takes place with a number of controversies affecting the Legislature as it begins a new session
Overview and Live Results: Virginia General Assembly Special Elections
The 2025 calendar kicks off with elections to fill three vacancies. Upsets could upend the balance of power in the General Assembly
Introducing the 2026 Senate Interactive Map
22 Republicans and 13 Democrats will be up in 2026; this includes special elections in Florida and Ohio.

Customize your map by changing one or more states. Return here to share it. Share or Embed your Map: Select 'Share Map' button above. Share or Embed your Map: