Princeton Election Consortium
Map Based on Polling
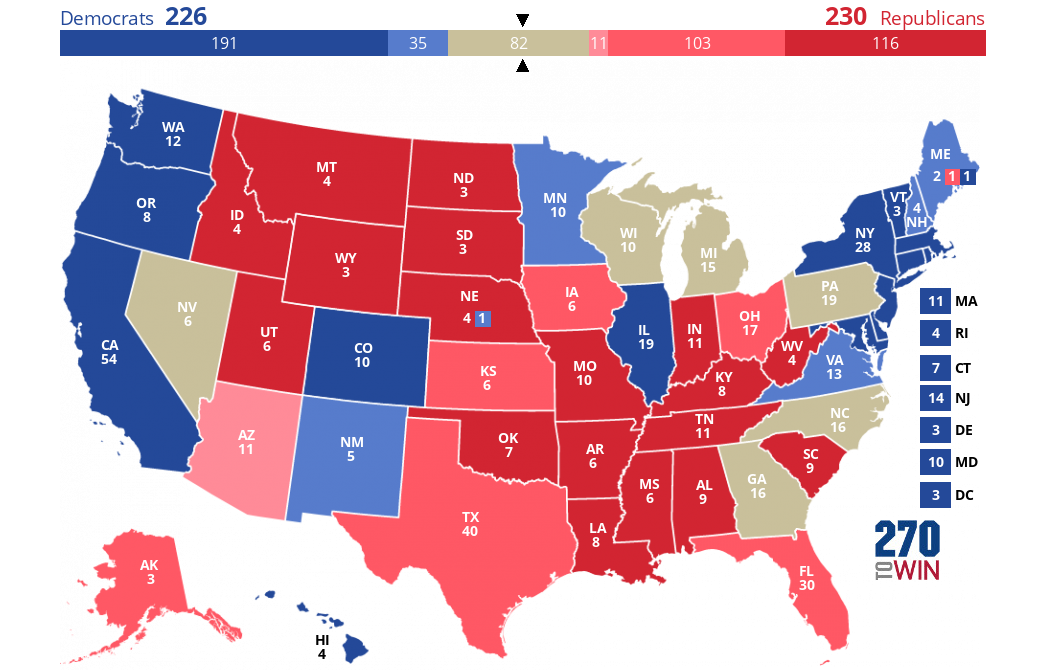
Part of the Princeton Election Consortium polling-derived forecast series for the likelihood of a Biden or Trump victory in each state.
You can view the full series of three maps here.
A state is shown as toss-up where the probability is 60% or less. The colored gradients get progressively deeper as the probability increases: Leans (<80%), Likely (<95%), Safe (95%+).
Use this map as a starting point to create and share your own 2020 presidential election forecast.

VT |
|
NH |
|
MA |
|
RI |
|
CT |
|
NJ |
|
DE |
|
MD |
|
DC |

Map :
DeSantis to Raise Money for Trump
RFK Jr. Pleads for Secret Service Protection
David Trone’s Firm Donates to Anti-Abortion Republicans
Bonus Quote of the Day
Tim Scott May Be Next to Join Trump at His Trial
Headlines
Overview and Live Results: Indiana Primary
Four competitive GOP primaries in deep red U.S. House seats will likely provide the most election day suspense
Live Results: Texas State Senate Special, Lubbock Mayor
The lone Senate vacancy will be filled, while voters in the nation's 85th largest city will choose a mayor
Live Results: New York Congressional District 26 Special Election
There is also a legislative special election runoff in Alabama
Live Results: Puerto Rico Democratic Primary
The territory is expected to add 55 delegates to Joe Biden's total, which now exceeds 3,300
Overview and Live Results: Pennsylvania Primary
Keystone State voters will weigh in on both presidential and downballot contests
Customize your map by changing one or more states. Return here to share it. Share or Embed your Map: Select 'Share Map' button above. Share or Embed your Map: