LATEST
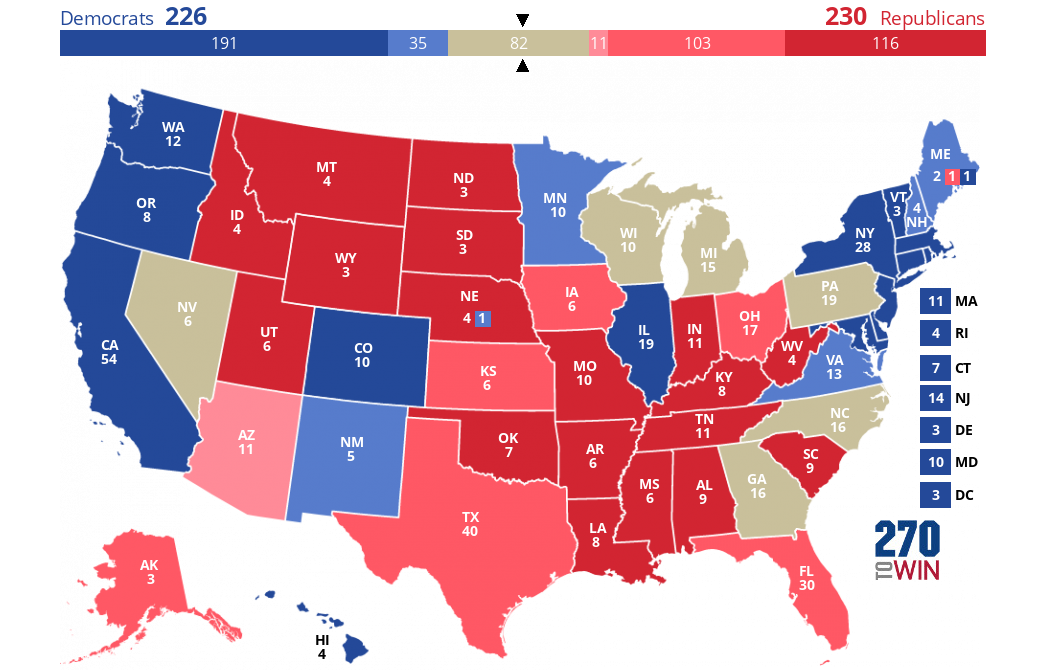
2020 President: Consensus Electoral Map
As of November 3, 2020
This map aggregates the ratings of nine organizations to come up with a consensus forecast for the 2020 presidential election.
Use the timeline feature to view the map as it looked at the end of each day.
Use this map as a starting point to create and share your own 2020 electoral map forecast.
November 3: Arizona moves from Leans Democratic to Toss-up.
The map at this URL was originally created for the 2020 election as a Trump vs. Biden forecast. For an interactive map, choose one of the following:

Democrats
VT |
|
NH |
|
MA |
|
RI |
|
CT |
|
NJ |
|
DE |
|
MD |
|
DC |

Map :
Democrats’ Ugliest Primary Comes to an End
“Maryland voters on Tuesday will end one of the ugliest Senate primaries of...
Why It’s So Hard to Poll RFK Jr.’s Support
New York Times: “Much of what influences third-party candidate support isn’t...
House Republicans Zero In on Wedge Issues
The House Republican leadership is moving into campaign mode after clearing must-pass...
Nevada Poses a Challenge and a Mystery for Biden
New York Times: “In Nevada, two of Mr. Biden’s biggest problems — his weakness...
Back to Normal May Not Be Enough for Biden
“President Biden has argued for years that he is the politician to restore normalcy...
Headlines
Overview and Live Results: Indiana Primary
May 7, 2024
Four competitive GOP primaries in deep red U.S. House seats will likely provide the most election day suspense
Live Results: Texas State Senate Special, Lubbock Mayor
May 4, 2024
The lone Senate vacancy will be filled, while voters in the nation's 85th largest city will choose a mayor
Live Results: New York Congressional District 26 Special Election
April 30, 2024
There is also a legislative special election runoff in Alabama
Live Results: Puerto Rico Democratic Primary
April 28, 2024
The territory is expected to add 55 delegates to Joe Biden's total, which now exceeds 3,300
Customize your map by changing one or more states. Return here to share it. Share or Embed your Map: Select 'Share Map' button above. Share or Embed your Map: