Oklahoma
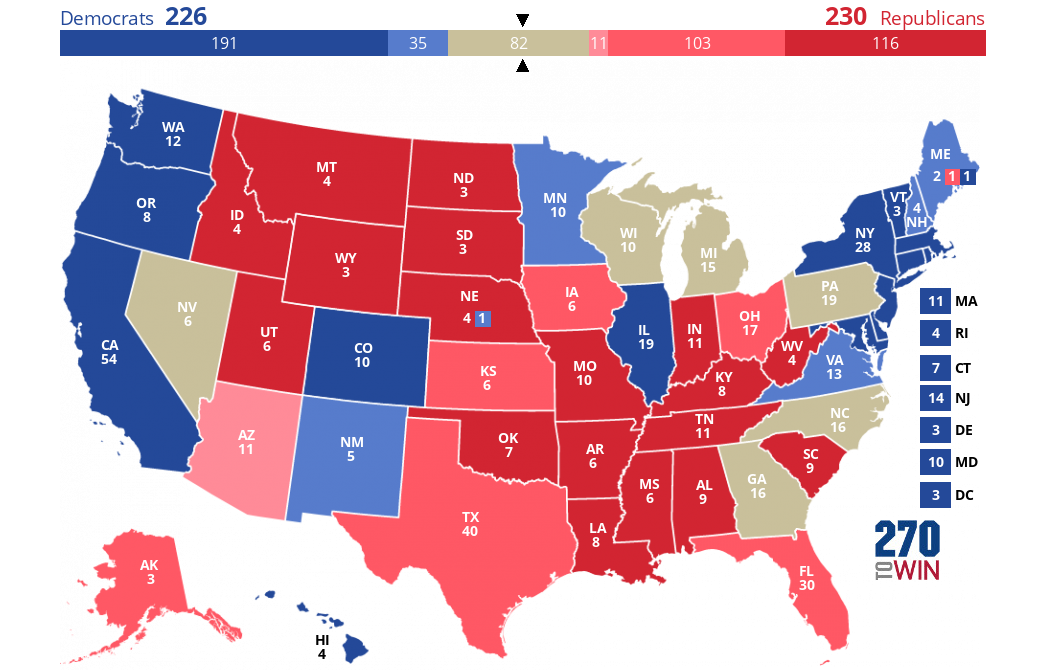
Oklahoma gained statehood in November 1907. The state voted Democratic in all but two elections through 1948, but has not gone Democratic since, except in the landslide win for Lyndon Johnson in 1964. Already fairly populous when admitted to the Union, the state had seven electoral votes in the 1908 election, the first in which it participated. No state outside the original 13 colonies, except Maine, started with more. In 2020, Donald Trump defeated Joe Biden by 65% to 32%, the fifth consecutive election that the Republican has won by over 30%.
ELECTORAL VOTES
72024 ELECTION
2024 Oklahoma Polls
Recent Presidential Elections
| 2020 |
|
|||
| 2016 |
|
|||
| 2012 |
|
|||
| 2008 |
|
|||
| 2004 |
|
|||
| 2000 |
|
Presidential Voting History
State voted with the overall winning candidate
Electoral College Votes
Colored bars represent electoral votes by party. Tap or hover to see names.
U.S. Senate Voting History
| Class | 1988 | 1990 | 1992 | 1994 | 1996 | 1998 | 2000 | 2002 | 2004 | 2006 | 2008 | 2010 | 2012 | 2014 | 2016 | 2018 | 2020 | 2022 | 2024 |
|---|---|---|---|---|---|---|---|---|---|---|---|---|---|---|---|---|---|---|---|
| 1 | |||||||||||||||||||
| 2 |
D
|
R
|
R
|
R
|
R
|
R
|
|||||||||||||
| 3 |
R
|
R
|
R
|
R
|
R
|
R
|
Data: MIT Election Data and Science Lab / Harvard Dataverse through 2018; 270toWin research. These are general election results for the years listed. Special elections, if any, are excluded.
There are three classes of Senators; one is up for election every second year. Each state has one Senator in two of the three classes.
U.S. House Voting History
| District | 1988 | 1990 | 1992 | 1994 | 1996 | 1998 | 2000 | 2002 | 2004 | 2006 | 2008 | 2010 | 2012 | 2014 | 2016 | 2018 | 2020 | 2022 | 2024 |
|---|---|---|---|---|---|---|---|---|---|---|---|---|---|---|---|---|---|---|---|
| 1 |
R
|
R
|
R
|
R
|
R
|
R
|
R
|
R
|
R
|
R
|
R
|
R
|
R
|
R
|
R
|
R
|
R
|
R
|
R
|
| 2 |
D
|
D
|
D
|
R
|
R
|
R
|
D
|
D
|
D
|
D
|
D
|
D
|
R
|
R
|
R
|
R
|
R
|
R
|
R
|
| 3 |
D
|
D
|
D
|
D
|
R
|
R
|
R
|
R
|
R
|
R
|
R
|
R
|
R
|
R
|
R
|
R
|
R
|
R
|
R
|
| 4 |
D
|
D
|
D
|
R
|
R
|
R
|
R
|
R
|
R
|
R
|
R
|
R
|
R
|
R
|
R
|
R
|
R
|
R
|
R
|
| 5 |
R
|
R
|
R
|
R
|
R
|
R
|
R
|
R
|
R
|
R
|
R
|
R
|
R
|
R
|
R
|
D
|
R
|
R
|
R
|
| 6 |
D
|
D
|
D
|
R
|
R
|
R
|
R
|
Data: The Princeton Gerrymandering Project through 2018; 270toWin research. These are general election results for the years listed. Special elections, if any, are excluded.
Vertical lines before 1992, 2002, 2012, and 2022 show Census-related redistricting breakpoints. Geographic borders associated with district numbers may have changed.
Governor Voting History
Data: Wikipedia through 2018; 270toWin research. These are general election results for the years listed. Special elections, if any, are excluded.

