2018 New Jersey House Election Interactive Map
All US House seats to be contested in 2018
New Jersey has 12 congressional districts, split between 7 Democrats and 5 Republicans. Four of the Republican-held seats look to be competitive in 2018, along with one Democratic seat. At least one, NJ-2, is very likely to flip to the Democrats.
To create your own forecast for the midterms, visit the 2018 House Interactive Map.

Hover over a district for details.
| District | Incumbent | Party | Since | Term | Predictions | Margin of Victory | ||||||||||||||||||||||||||||||||||||||||||||||||||||||||||||||||||||||||||||||||||||||||||||
|---|---|---|---|---|---|---|---|---|---|---|---|---|---|---|---|---|---|---|---|---|---|---|---|---|---|---|---|---|---|---|---|---|---|---|---|---|---|---|---|---|---|---|---|---|---|---|---|---|---|---|---|---|---|---|---|---|---|---|---|---|---|---|---|---|---|---|---|---|---|---|---|---|---|---|---|---|---|---|---|---|---|---|---|---|---|---|---|---|---|---|---|---|---|---|---|---|---|---|
| Pro | Map | House(a) | President(b) | |||||||||||||||||||||||||||||||||||||||||||||||||||||||||||||||||||||||||||||||||||||||||||||||
| NJ-2 | 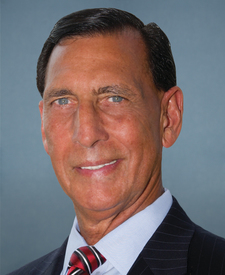 |
Frank LoBiondo | 1995 | 12th |
|
22.0% | 4.6% | |||||||||||||||||||||||||||||||||||||||||||||||||||||||||||||||||||||||||||||||||||||||||||
|
Incumbent not running for re-election in 2018.
|
||||||||||||||||||||||||||||||||||||||||||||||||||||||||||||||||||||||||||||||||||||||||||||||||||
| NJ-3 | 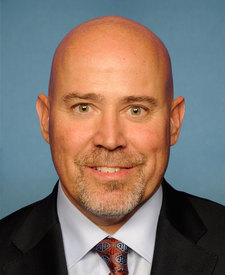 |
Tom MacArthur | 2015 | 2nd |
|
20.4% | 6.2% | |||||||||||||||||||||||||||||||||||||||||||||||||||||||||||||||||||||||||||||||||||||||||||
| NJ-5 | 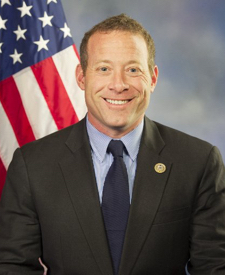 |
Josh Gottheimer | 2017 | 1st |
|
4.4% | 1.0% | |||||||||||||||||||||||||||||||||||||||||||||||||||||||||||||||||||||||||||||||||||||||||||
| NJ-7 | 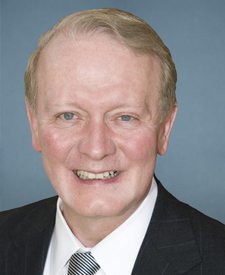 |
Leonard Lance | 2009 | 5th |
|
11.0% | 1.1% | |||||||||||||||||||||||||||||||||||||||||||||||||||||||||||||||||||||||||||||||||||||||||||
| NJ-11 | 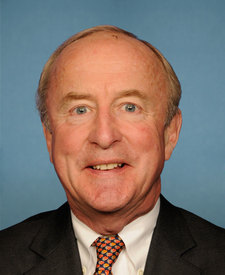 |
Rodney Frelinghuysen | 1995 | 12th |
|
19.1% | 0.8% | |||||||||||||||||||||||||||||||||||||||||||||||||||||||||||||||||||||||||||||||||||||||||||
|
Incumbent not running for re-election in 2018.
|
||||||||||||||||||||||||||||||||||||||||||||||||||||||||||||||||||||||||||||||||||||||||||||||||||
| NJ-1 | 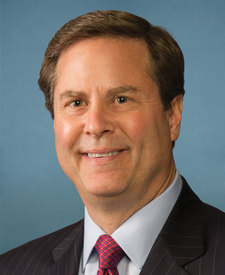 |
Donald Norcross | 2014 | 3rd |
|
23.2% | 24.5% | |||||||||||||||||||||||||||||||||||||||||||||||||||||||||||||||||||||||||||||||||||||||||||
| NJ-4 | 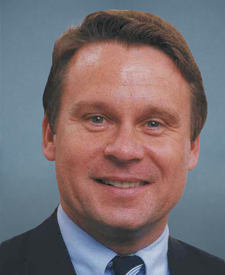 |
Christopher Smith | 1981 | 19th |
|
30.2% | 14.8% | |||||||||||||||||||||||||||||||||||||||||||||||||||||||||||||||||||||||||||||||||||||||||||
| NJ-6 | 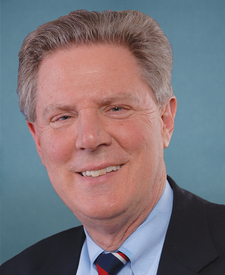 |
Frank Pallone | 1988 | 16th |
|
28.8% | 15.6% | |||||||||||||||||||||||||||||||||||||||||||||||||||||||||||||||||||||||||||||||||||||||||||
| NJ-8 | 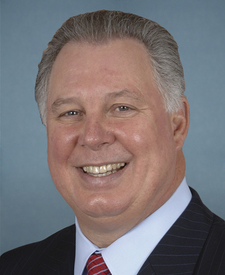 |
Albio Sires | 2006 | 7th |
|
58.5% | 54.2% | |||||||||||||||||||||||||||||||||||||||||||||||||||||||||||||||||||||||||||||||||||||||||||
| NJ-9 | 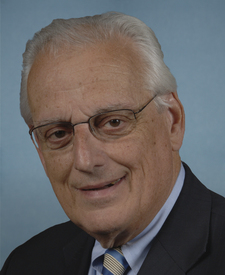 |
Bill Jr. Pascrell | 1997 | 11th |
|
41.7% | 31.2% | |||||||||||||||||||||||||||||||||||||||||||||||||||||||||||||||||||||||||||||||||||||||||||
| NJ-10 | 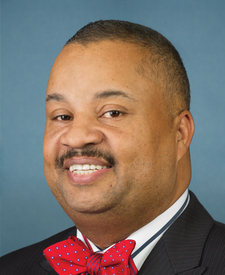 |
Donald Payne Jr. | 2012 | 4th |
|
73.8% | 72.4% | |||||||||||||||||||||||||||||||||||||||||||||||||||||||||||||||||||||||||||||||||||||||||||
| NJ-12 | 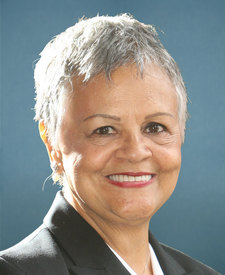 |
Bonnie Coleman | 2015 | 2nd |
|
30.8% | 33.2% | |||||||||||||||||||||||||||||||||||||||||||||||||||||||||||||||||||||||||||||||||||||||||||
(a)Source: Ballotpedia (for margins). The margin is the percentage difference between the top two vote-getters in 2016.
More recent results (i.e., special elections held in 2017-18 for vacancies) are not displayed.
* Race was uncontested | ^Top two vote-getters were from the same party
(b)Source: Daily Kos. The margin is the percentage difference between Donald Trump and Hillary Clinton.

