2018 Tennessee House Election Interactive Map
All US House seats to be contested in 2018
Tennessee has nine congressional districts, seven of which are held by Republicans. All nine seats are deemed safe for the incumbent party. The Volunteer State is tied with Massachusetts for the most congressional districts where not a single one of them is competitive. Three of the seven Republicans are not running for reelection in 2018.
To create your own forecast for the midterms, visit the 2018 House Interactive Map.

Hover over a district for details.
| District | Incumbent | Party | Since | Term | Predictions | Margin of Victory | ||||||||||||||||||||||||||||||||||||||||||||||||||||||||||||||||||||||||||||||||||||||||||||
|---|---|---|---|---|---|---|---|---|---|---|---|---|---|---|---|---|---|---|---|---|---|---|---|---|---|---|---|---|---|---|---|---|---|---|---|---|---|---|---|---|---|---|---|---|---|---|---|---|---|---|---|---|---|---|---|---|---|---|---|---|---|---|---|---|---|---|---|---|---|---|---|---|---|---|---|---|---|---|---|---|---|---|---|---|---|---|---|---|---|---|---|---|---|---|---|---|---|---|
| Pro | Map | House(a) | President(b) | |||||||||||||||||||||||||||||||||||||||||||||||||||||||||||||||||||||||||||||||||||||||||||||||
| TN-1 |  |
Phil Roe | 2009 | 5th |
|
62.9% | 57.0% | |||||||||||||||||||||||||||||||||||||||||||||||||||||||||||||||||||||||||||||||||||||||||||
| TN-2 |  |
John J. Duncan Jr. | 1988 | 16th |
|
51.3% | 35.4% | |||||||||||||||||||||||||||||||||||||||||||||||||||||||||||||||||||||||||||||||||||||||||||
|
Incumbent not running for re-election in 2018.
|
||||||||||||||||||||||||||||||||||||||||||||||||||||||||||||||||||||||||||||||||||||||||||||||||||
| TN-3 |  |
Chuck Fleischmann | 2011 | 4th |
|
37.6% | 35.2% | |||||||||||||||||||||||||||||||||||||||||||||||||||||||||||||||||||||||||||||||||||||||||||
| TN-4 |  |
Scott DesJarlais | 2011 | 4th |
|
30.1% | 41.2% | |||||||||||||||||||||||||||||||||||||||||||||||||||||||||||||||||||||||||||||||||||||||||||
| TN-5 | 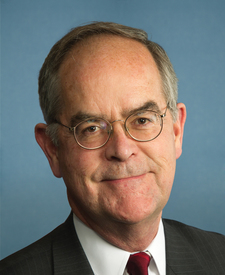 |
Jim Cooper | 2003 | 8th |
|
25.1% | 18.4% | |||||||||||||||||||||||||||||||||||||||||||||||||||||||||||||||||||||||||||||||||||||||||||
| TN-6 | 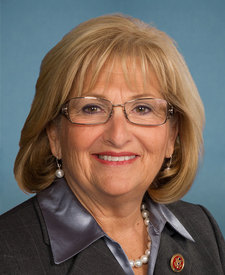 |
Diane Black | 2011 | 4th |
|
49.3% | 48.9% | |||||||||||||||||||||||||||||||||||||||||||||||||||||||||||||||||||||||||||||||||||||||||||
|
Incumbent not running for re-election in 2018.
|
||||||||||||||||||||||||||||||||||||||||||||||||||||||||||||||||||||||||||||||||||||||||||||||||||
| TN-7 | 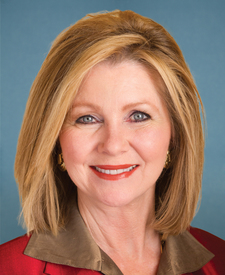 |
Marsha Blackburn | 2003 | 8th |
|
48.7% | 39.3% | |||||||||||||||||||||||||||||||||||||||||||||||||||||||||||||||||||||||||||||||||||||||||||
|
Incumbent not running for re-election in 2018.
|
||||||||||||||||||||||||||||||||||||||||||||||||||||||||||||||||||||||||||||||||||||||||||||||||||
| TN-8 |  |
David Kustoff | 2017 | 1st |
|
43.7% | 35.6% | |||||||||||||||||||||||||||||||||||||||||||||||||||||||||||||||||||||||||||||||||||||||||||
| TN-9 | 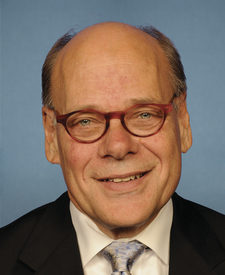 |
Steve Cohen | 2007 | 6th |
|
59.9% | 57.7% | |||||||||||||||||||||||||||||||||||||||||||||||||||||||||||||||||||||||||||||||||||||||||||
(a)Source: Ballotpedia (for margins). The margin is the percentage difference between the top two vote-getters in 2016.
More recent results (i.e., special elections held in 2017-18 for vacancies) are not displayed.
* Race was uncontested | ^Top two vote-getters were from the same party
(b)Source: Daily Kos. The margin is the percentage difference between Donald Trump and Hillary Clinton.

