Electoral Maps: Consensus vs. Polling
Compare the expert consensus forecast with a map based exclusively on polling.
The major difference is that the expert forecast is forward looking (i.e., the election is in November), while the polling map is more of a look at "if the election was today."
As the election draws near, the two maps should converge. State-level polling will become more frequent, and will also get greater weighting in the expert forecasts.
Click either map for an interactive version. The images on this page will automatically update as the underlying maps change.
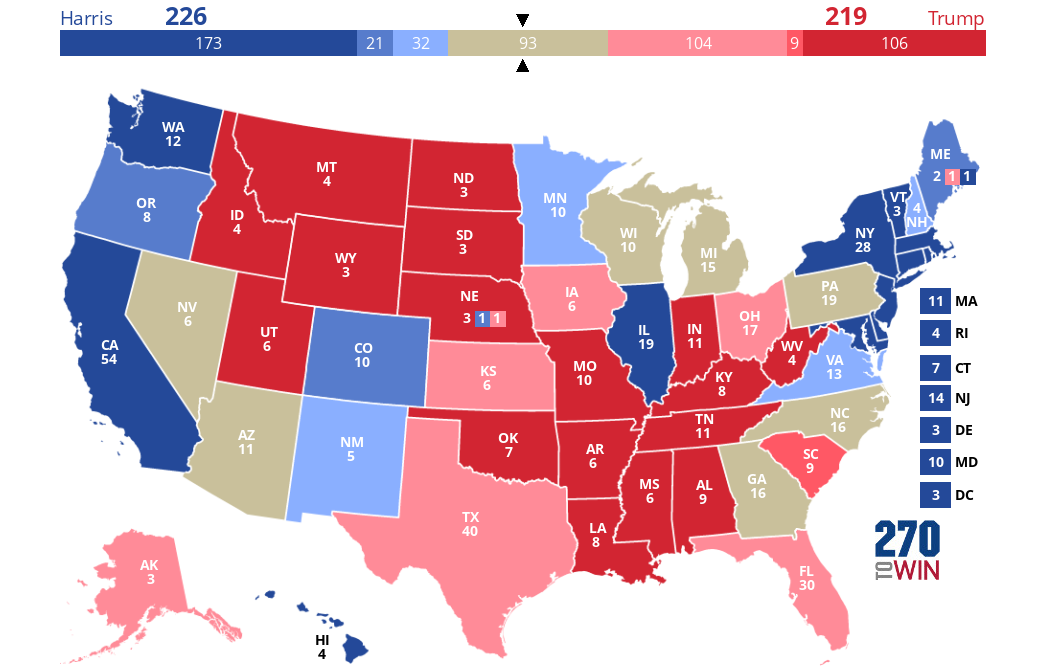
Consensus Forecast
This map tracks the consensus forecast for the 2024 presidential election. It is a composite of ratings by several forecasters. Only states rated safe by a large majority of forecasters are shown in the darkest shade of blue or red on the map. This allows for a more inclusive look at states that could be competitive in the right circumstances.
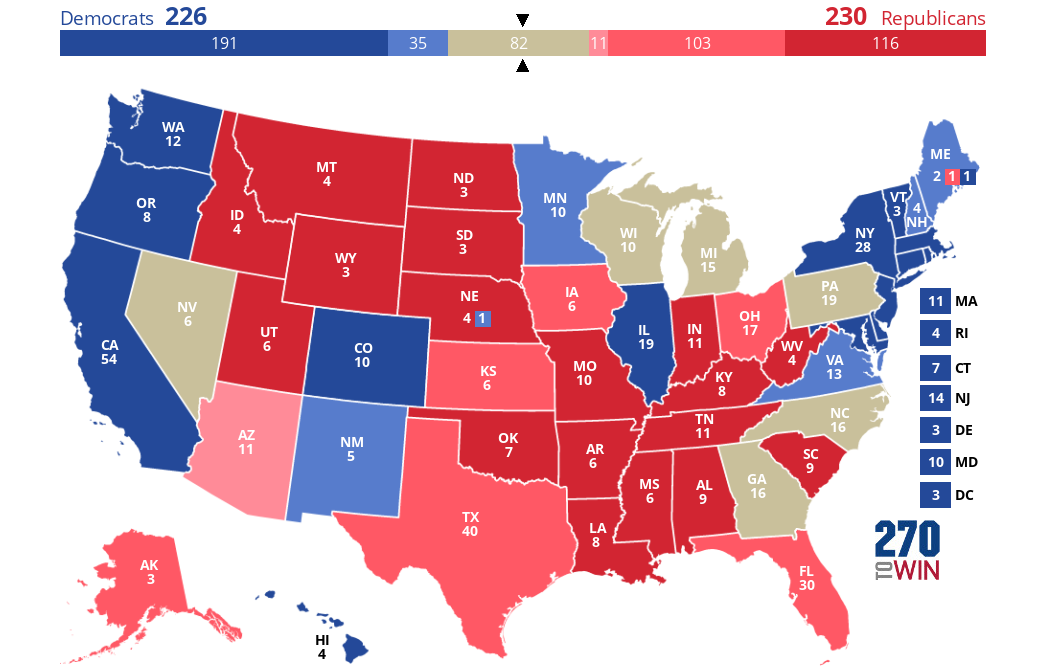
Polling Map
This map tracks the Harris-Trump electoral vote count for the 2024 presidential election based entirely on polls. Where polling is not yet available, we use the Consensus Forecast rating. These are all states not seen as competitive.
Polling averages are translated to ratings based on this scale: Toss-up is 4% or less, Leans up to 8%, Likely up to 12%. States >12% are shown as Safe.
Keep in mind that polls are a snapshot in time, reflecting public opinion when they are conducted. As such, they may be of limited predictive value until the election gets closer.
View the most recent polls. View the current polling averages by state.