Coming Soon: Historical Interactive Maps
By 270toWin Staff
May 18, 2015
Update: The first three historical maps are available to try out. Let us know if you find any issues or have feedback.
**Use the comments to let us know if you would find this feature useful and what year(s) you'd like to see first.**
One of the more popular feature requests we get is to have interactive maps for historical presidential elections. There are a lot of fans of alternate history scenarios as well as those that would like to change past electoral maps in a 'what if' kind of way.
Starting with the actual historical election result, you'll be able to modify the winner in each state and the distribution of electoral votes. You'll also be able to make some changes to the names in the race to create alternate scenarios (e.g., what if Robert Kennedy had lived and become the 1968 Democratic nominee)?
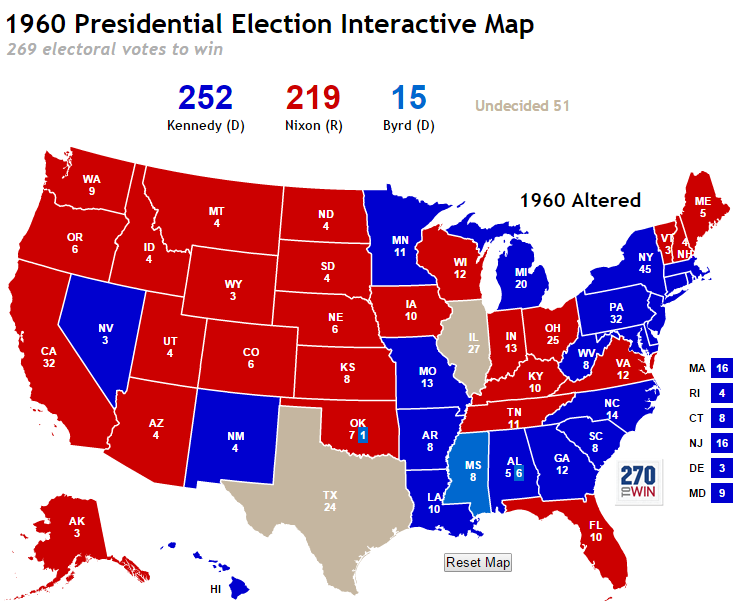
In the sample below, we have taken the 1960 election and set Illinois and Texas to undecided, putting Kennedy below the 269 electoral votes needed to win that year*. These two states' results were among many decided by 2% or less that year and were among the more controversial.

* There were 537 electoral votes in 1960, reflecting the addition of Alaska and Hawaii with 3 electoral votes each. These additions temporarily increased the size of The House from 435 to 437 Members (+100 Senators = 537). The Census reapportionment after 1960 reset the House to the required 435, while the 23rd Amendment gave Washington D.C. electoral representation with 3 electoral votes. As a result, there have been 538 electoral votes available since 1964 (435+100+3), with 270 required to win.

