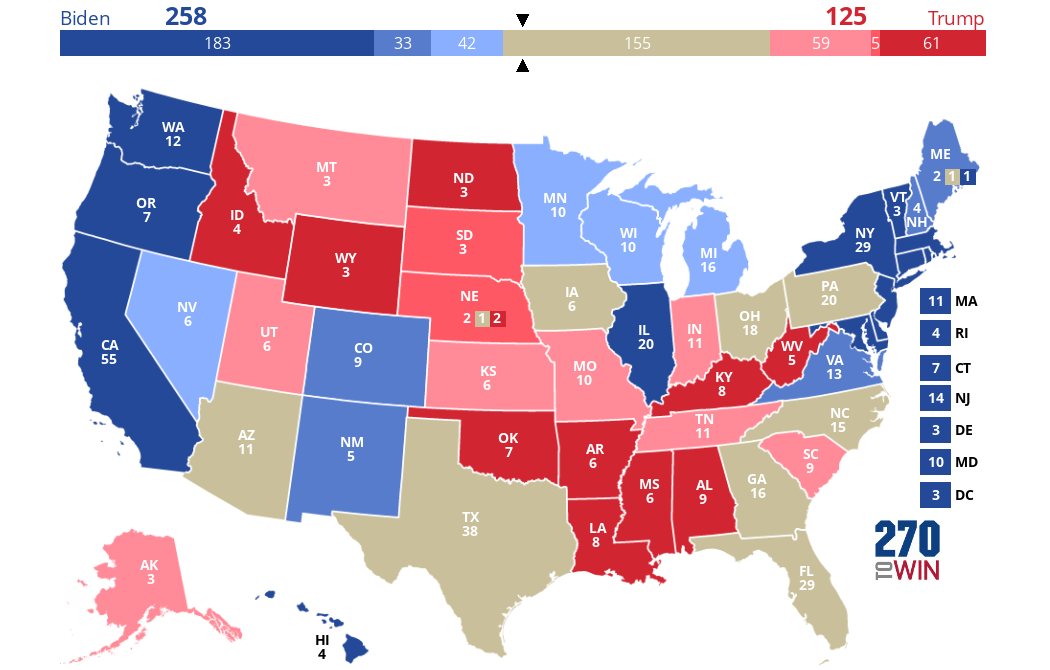
2020 Electoral Map Based on Polling Averages

In response to many requests, we've created a map that will track the electoral vote based exclusively on polling averages. While good as a benchmark, keep in mind that polling this far from the election may ultimately prove to be of limited predictive value.

If the difference between Biden and Trump is less than 5%, these will display as toss-ups. States are shown as leaning toward a candidate if the margin is 5 to 9.99%.  Likely is 10 to 14.99%, with states shown as safe where the margin is 15% or more.

Where polling is not yet available, we are using the actual margin between Clinton and Trump in 2016.  
comments powered by Disqus

Headlines

Overview and Live Results: Wisconsin Supreme Court Election

One of the more consequential races of 2025 will decide the ideological balance of the court

Overview and Live Results: Florida Congressional Special Elections

While winning might be a bridge too far for Dems in these deep red districts, a close outcome will

Live Results: April 1 Legislative Special Elections

Voters in Florida, Oklahoma, and South Carolina will begin the process of filling a number of legislative vacancies

Live Results: Omaha Mayoral Primary

Republican Mayor Jean Stothert seeks an unprecedented 4th term in office

Live Results: Louisiana Proposed Constitutional Amendments

These statewide ballot measures are part of the March 29 municipal election