Electoral Map Based on FiveThirtyEight Model
By 270toWin Staff
August 15, 2020
We've added an electoral map that is derived from the FiveThirtyEight 2020 Election Forecast that was released earlier this week. The map will update every two hours, reflecting the then-current probabilities for each state. The current map is below; click or tap for an interactive version.
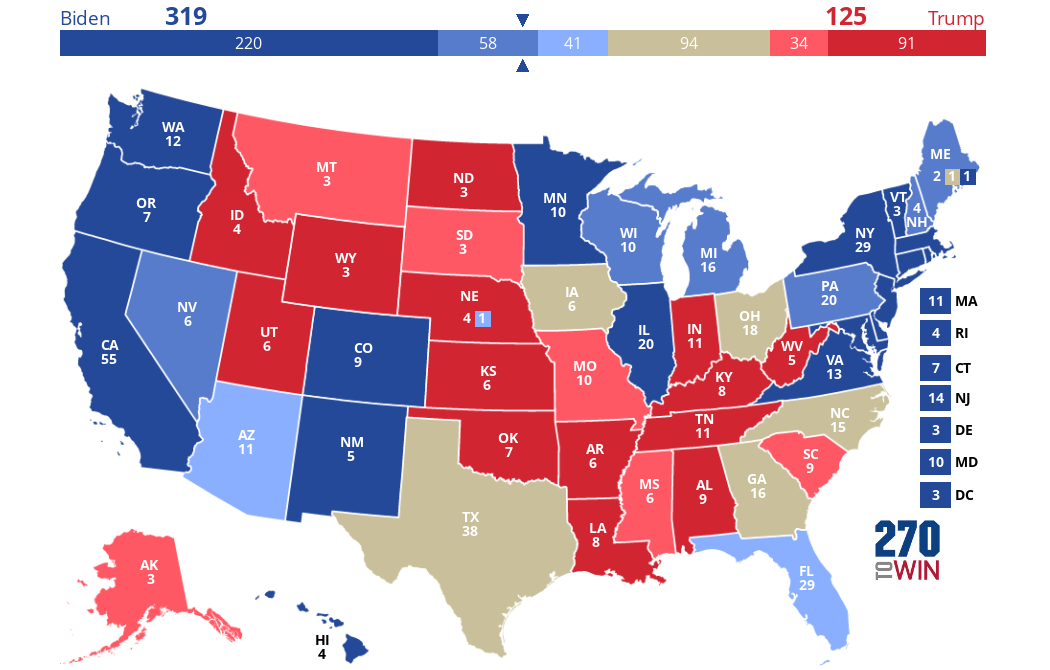
The color breakpoints are always somewhat arbitrary with a statistical model, but we've selected ranges that seem to fit best when comparing to other forecasts. The toss-up color is used where neither candidate has a 65% chance of winning. The lightest red/blue gradient is 65%+, medium 80%+ and darkest 95%+.
This FiveThirtyEight article discusses the methodology behind their model.
Headlines
Live Results: New York City Ranked Choice Tabulation
Zohran Mamdani is expected to move one step closer to being certified as the Democratic nominee for mayor
Sen. Thom Tillis Will Not Seek Reelection Next Year
He had come under attack from Trump after voting "no" to advance the president's signature legislation
Nebraska Rep. Don Bacon Not Seeking Reelection in 2026
A formal announcement will come Monday; Bacon was seen as among the more endangered Republicans next year
Overview and Live Results: New York City Mayoral Primary
Several other city offices are on the ballot
Live Results: Buffalo Mayoral Primary and Legislative Special Elections
Buffalo's acting mayor seeks renomination for a full term; a FL special features the ultimate sibling rivalry

