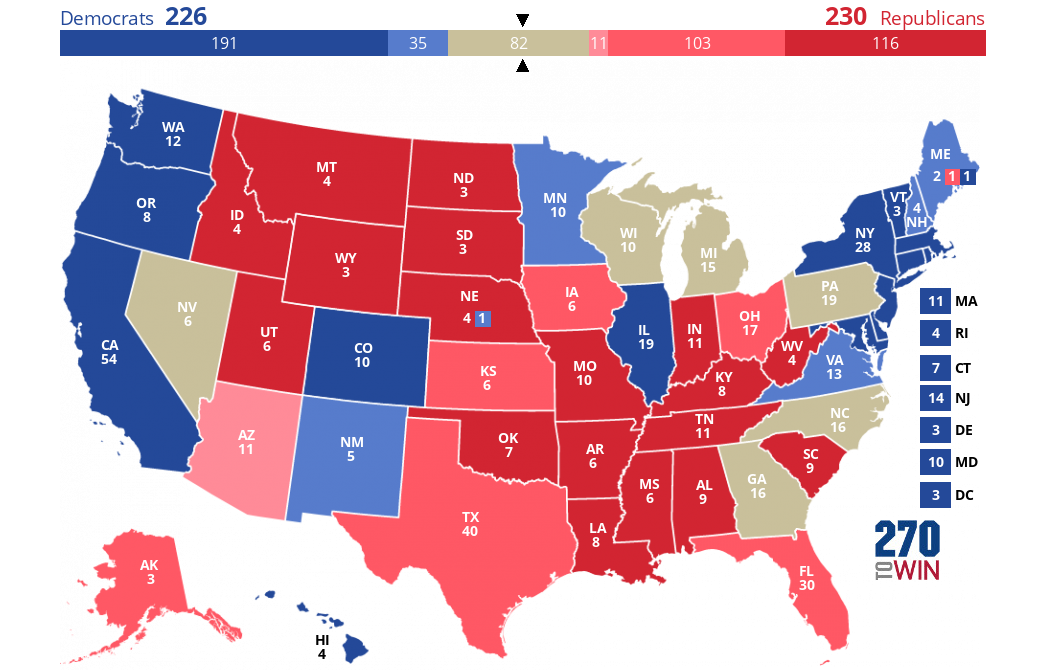
2016 Presidential Election Forecasts
These maps reflect the ratings of a number of quantitative and qualitative forecasters, as well as some consensus projections. Click or tap any of the thumbnails for an interactive version that you can use to create and share your own 2016 Presidential forecast.
| Aggregated Maps: | Poll-Based | Poll-Based (no toss-ups) | Consensus |
| Statistical Models: | FiveThirtyEight | Princeton | PredictWise | NYT Upshot |
| Full-time Analysts: | Sabato’s Crystal Ball | Cook Political | Rothenberg & Gonzales |
| Media Analysis: | ABC | AP | CNN | FOX | NBC | NPR | The Fix | Governing |
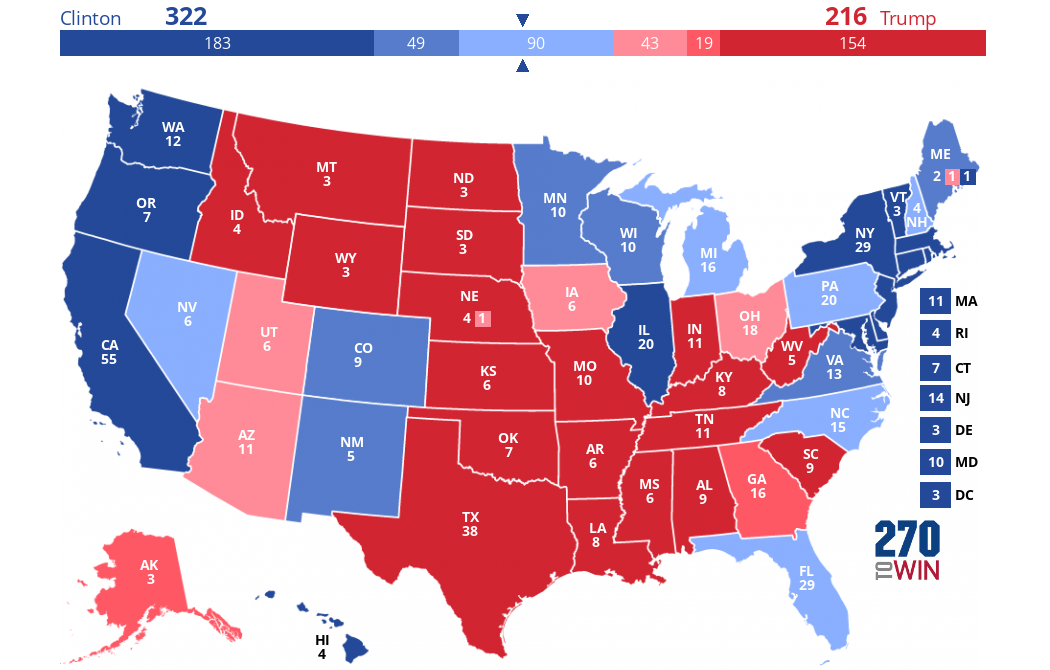
Crystal Ball 2016 Electoral College Ratings
This was the final projection for the 2016 election from Larry Sabato and the team at the University of Virginia Center for Politics. Use this map as a starting point to create and share your own 2020 presidential election forecast.
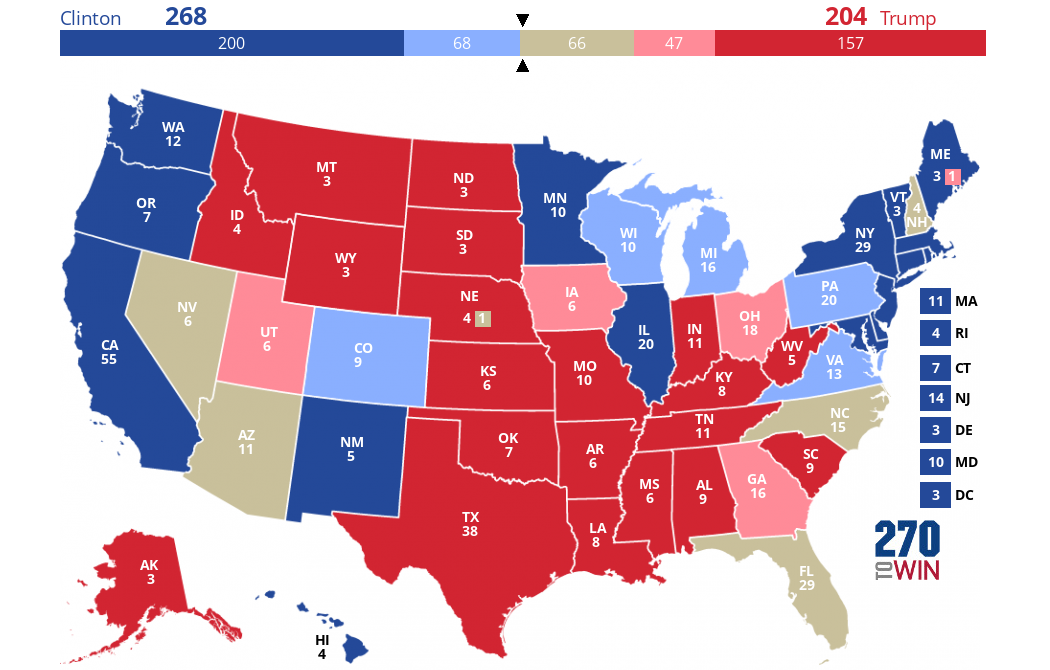
Associated Press Electoral Map Analysis
The Associated Press analysis of the electoral map as of November 7th.
Use this map as a starting point to create and share your own 2016 presidential election forecast.
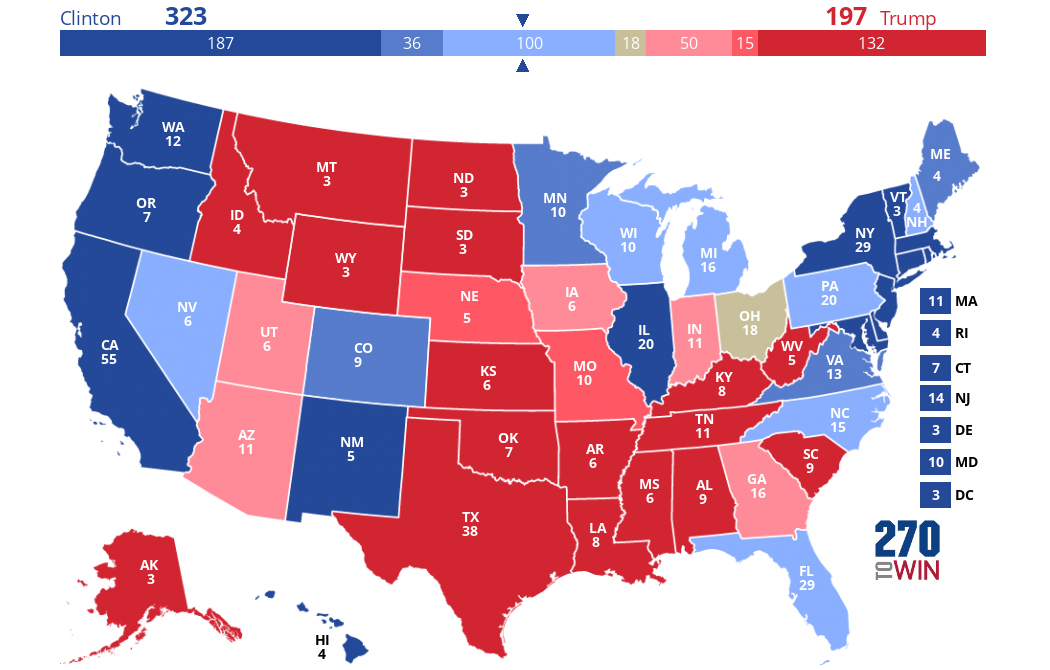
Princeton Election Consortium Electoral Map
Colors indicate likelihood for a Clinton or Trump victory in each state based on current polling. See the Princeton Election Consortium site for probability color scheme.
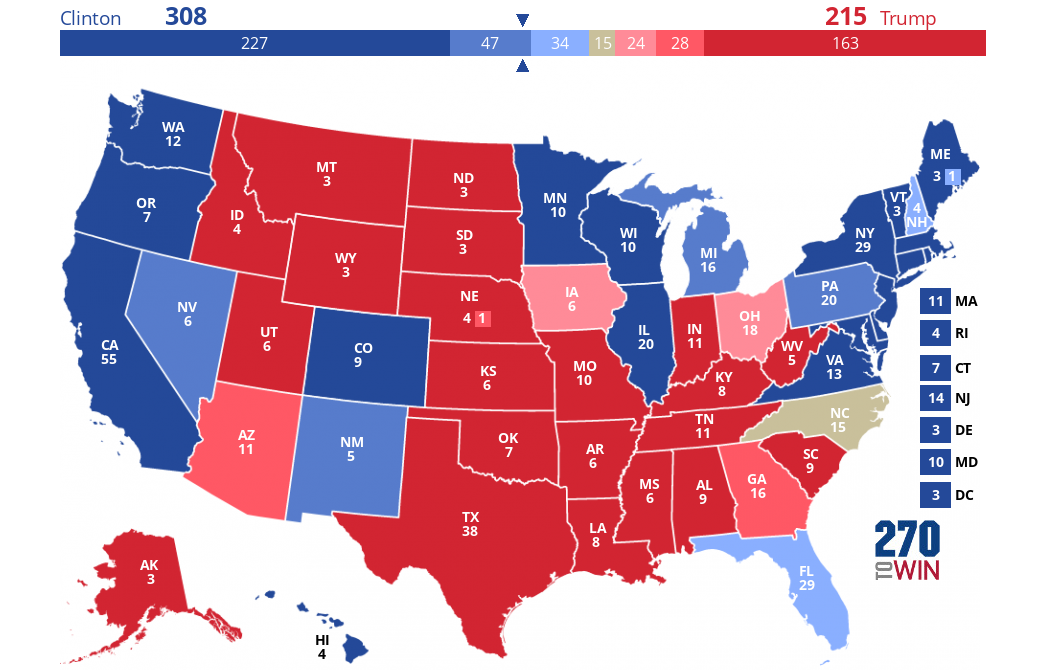
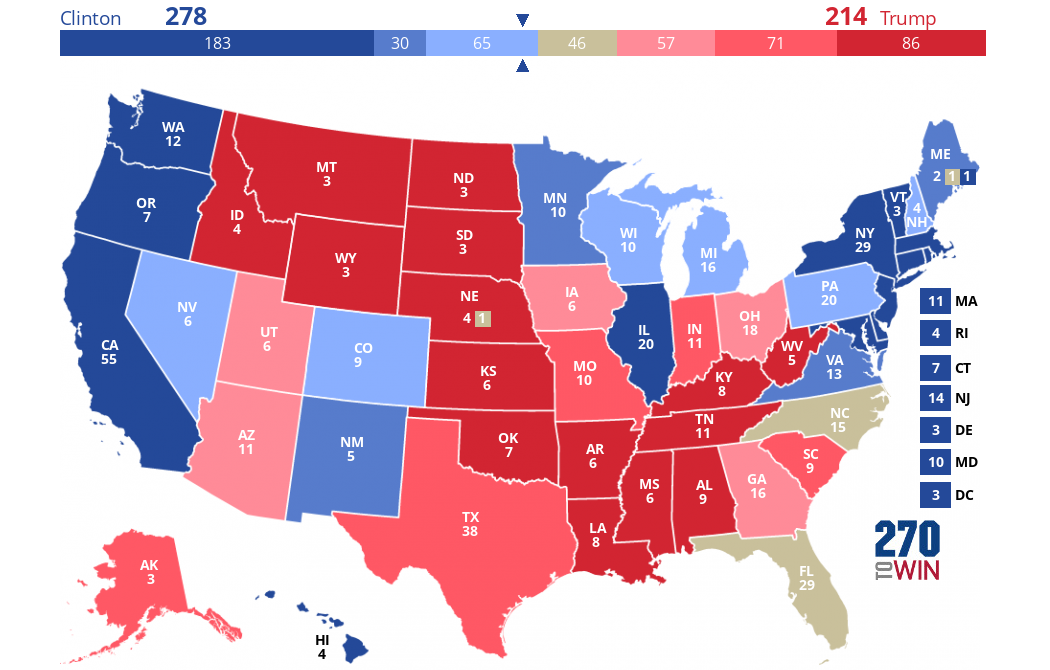
FiveThirtyEight Polls-Plus Forecast
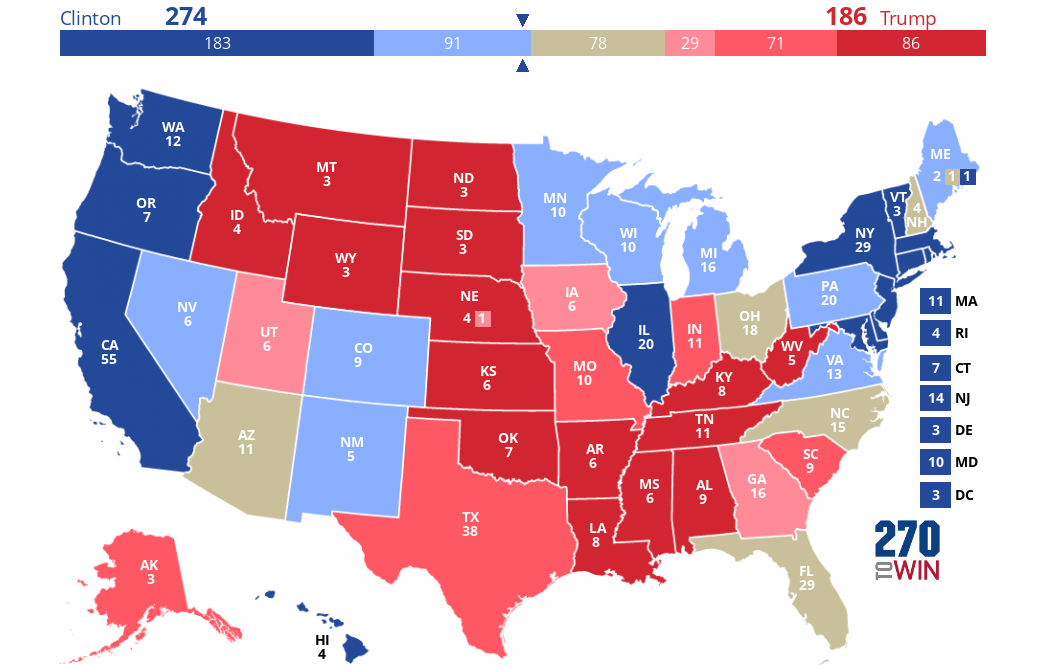
Updated hourly, this is an electoral map derived from the polls-plus forecast from FiveThirtyEight. This is defined as "what polls, the economy and historical data tell us about Nov. 8."
The toss-up tan color is used when no candidate has a 60% or higher chance of winning. The colored gradients are used to show higher probabilities for Clinton or Trump, deepening as the chance of winning increases: Light (60%+), Medium (80%+), Dark (90%+).
The ratings below reflect the final update before the 2016 election. Use it as a starting point to create and share your own 2020 presidential election forecast.
CNN Electoral College Map
From CNN: There are very few things that the Donald Trump and Hillary Clinton campaigns agree on these days, but one point of total agreement is that this race has tightened over the last 10-14 days."
Use this map as a starting point to create and share your own 2016 presidential election forecast.
Cook Political Report Forecast
This was the final projection for the 2016 election from Cook Political Report. Use this as a starting point to create and share your own 2020 presidential election forecast.
To learn more or to subscribe, visit The Cook Political Report.
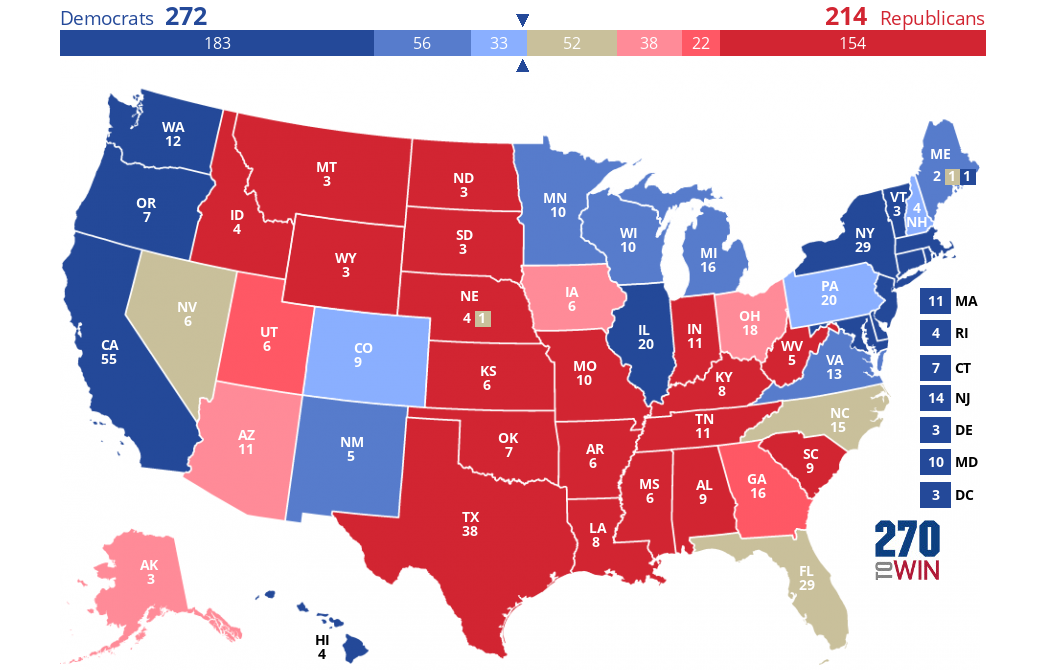
Rothenberg & Gonzales Ratings
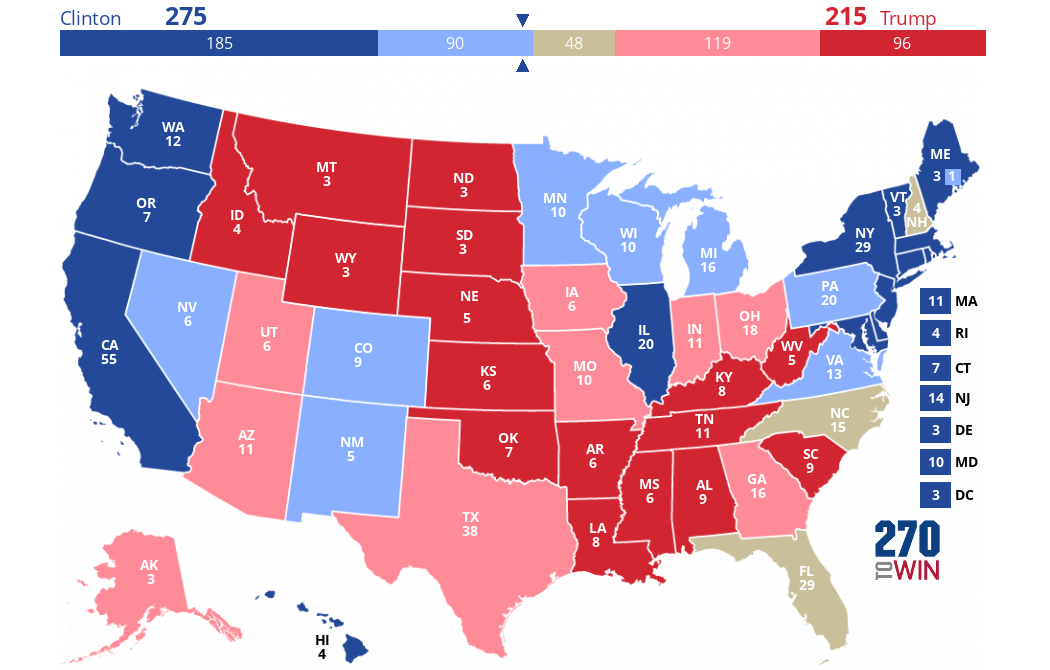
Final projection* for the 2016 election from Rothenberg & Gonzales Political Report. Use this as a starting point to create and share your own 2016 election forecast.
To learn more or to subscribe, visit The Rothenberg & Gonzales Political Report.
*Toss-up/Tilt states are shown as Lean Clinton: FL, NC, NV, WI and Lean Trump: AZ, IA
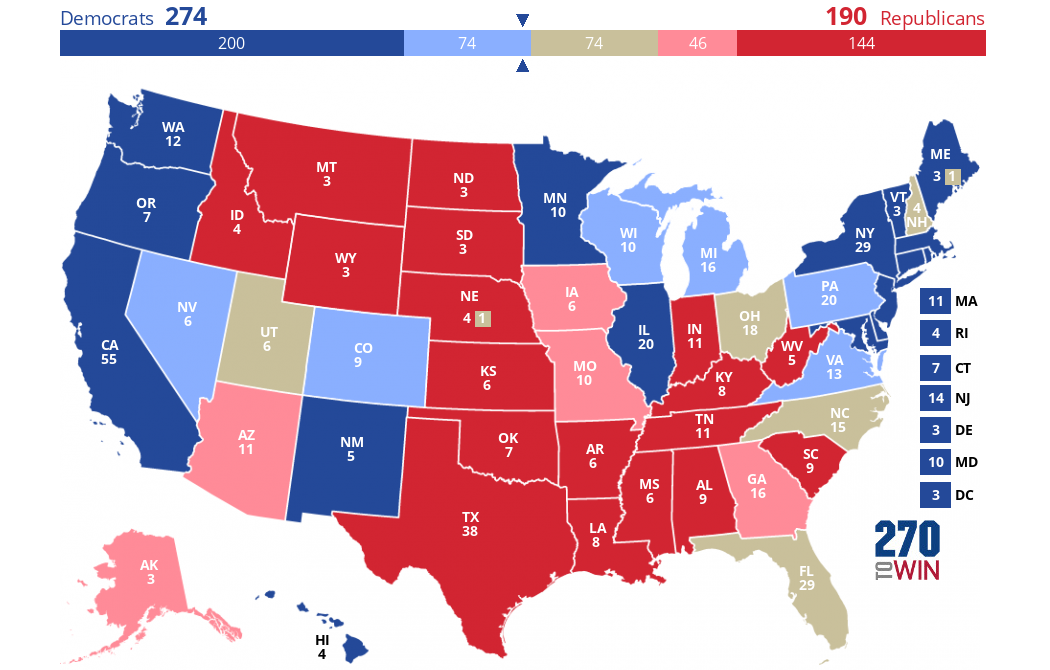
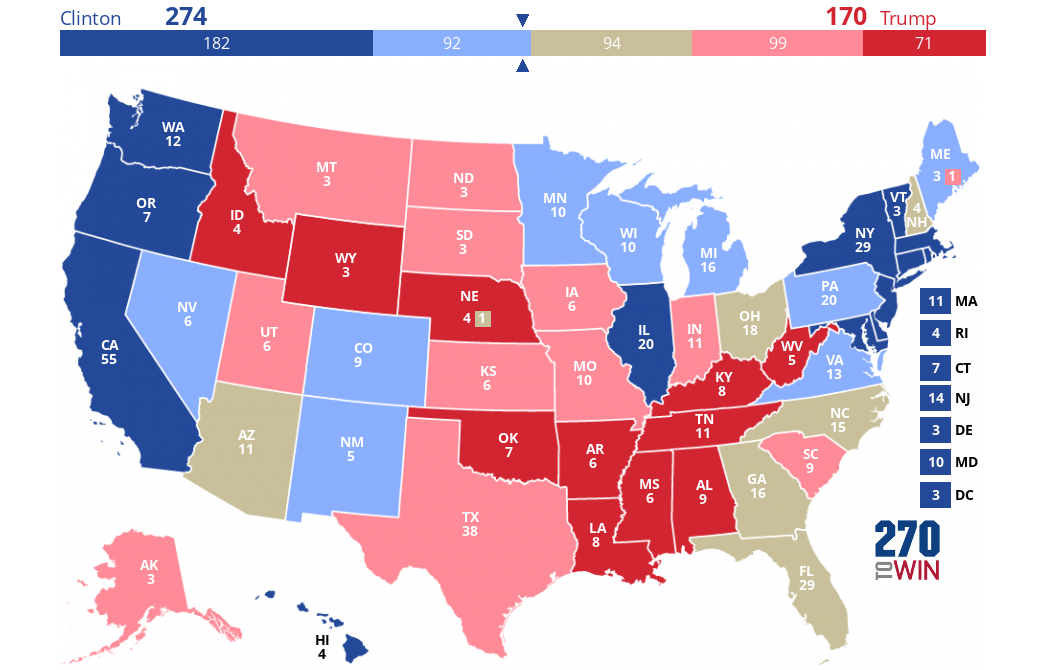
NBC General Election Battleground Map
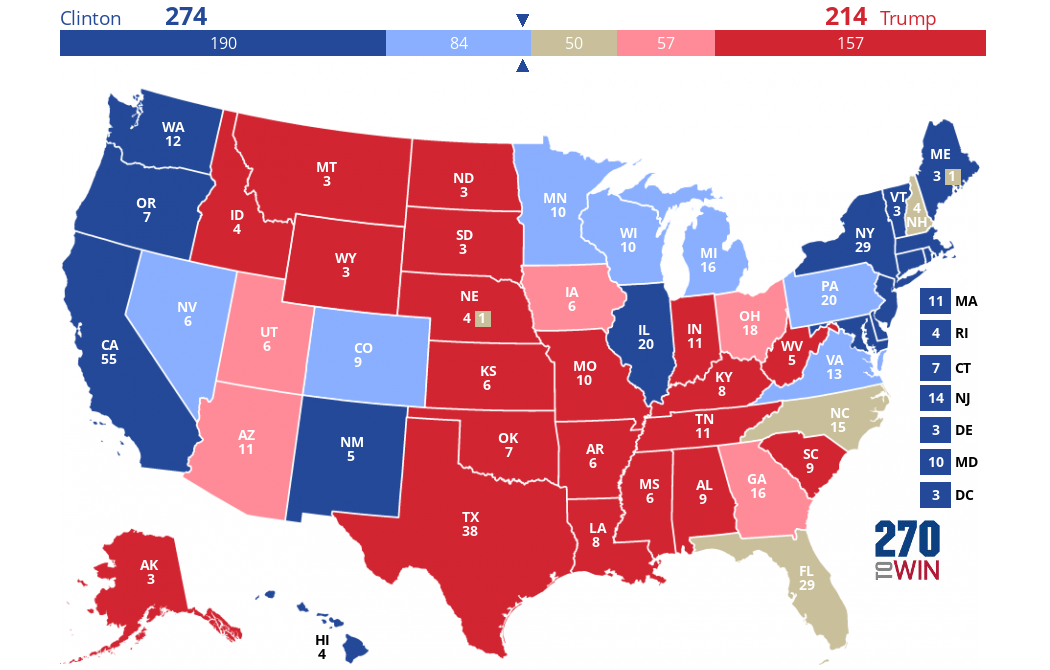
From the NBC News Political Unit: "In our final battleground map of the 2016 presidential race, Hillary Clinton holds a substantial lead over Donald Trump". "Clinton has 274 electoral votes in her column (which) is more than the 270 needed to win the presidency."
Use this map as a starting point to create and share your own 2016 presidential election forecast.
NPR General Election Ratings
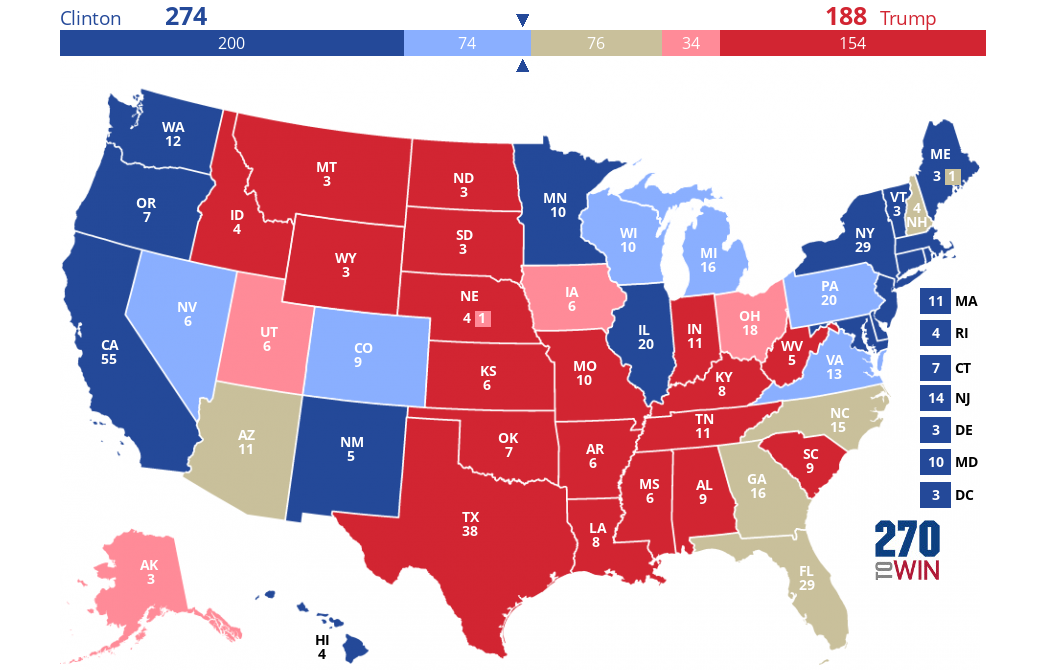
From NPR: "Election Day is nearly upon us. So where does the electoral map stand? It's a close race, with Hillary Clinton retaining a broad and consistent but shallow advantage, according to the final NPR Battleground Map."
Use this map as a starting point to create and share your own 2016 presidential election forecast.
The Fix Electoral College Ratings
The final electoral college ratings map from "The Fix" political team at The Washington Post. Use this as a starting point to create and share your own 2016 election forecast.
Follow @TheFix on Twitter for their latest commentary and analysis of the 2016 elections.
Louis Jacobson/Governing 2016 Electoral Map
Final 2016 projection from Louis Jacobson, who has handicapped the electoral college in 2008, 2012 and 2016, most recently for Governing magazine, where he writes a twice-monthly column on state politics. Jacobson is also a senior correspondent with PolitiFact and senior author of the Almanac of American Politics 2016.
This analysis also ranks states from most likely to go Republican to most likely to go Democratic. Full report.
ABC News Presidential State Ratings
ABC News electoral map ratings updated November 4th.
Use this map as a starting point to create and share your own 2016 presidential election forecast.
