2018 Florida House Election Interactive Map
All US House seats to be contested in 2018
Florida has 27 congressional districts, tied with New York for 3rd most in the country. A number of districts have been added to the potentially competitive list as 2018 has progressed. Of these, FL-26 and FL-27 in the southern part of the state look to be the most competitive. In the 2016 election, these two were part of only 25 districts nationwide that elected a Republican to Congress, while also voting for Hillary Clinton.
To create your own forecast for the midterms, visit the 2018 House Interactive Map.

Hover over a district for details.
| District | Incumbent | Party | Since | Term | Predictions | Margin of Victory | ||||||||||||||||||||||||||||||||||||||||||||||||||||||||||||||||||||||||||||||||||||||||||||
|---|---|---|---|---|---|---|---|---|---|---|---|---|---|---|---|---|---|---|---|---|---|---|---|---|---|---|---|---|---|---|---|---|---|---|---|---|---|---|---|---|---|---|---|---|---|---|---|---|---|---|---|---|---|---|---|---|---|---|---|---|---|---|---|---|---|---|---|---|---|---|---|---|---|---|---|---|---|---|---|---|---|---|---|---|---|---|---|---|---|---|---|---|---|---|---|---|---|---|
| Pro | Map | House(a) | President(b) | |||||||||||||||||||||||||||||||||||||||||||||||||||||||||||||||||||||||||||||||||||||||||||||||
| FL-6 |  |
OPEN |
|
17.1% | 17.0% | |||||||||||||||||||||||||||||||||||||||||||||||||||||||||||||||||||||||||||||||||||||||||||||
| FL-7 |  |
Stephanie Murphy | 2017 | 1st |
|
3.0% | 7.3% | |||||||||||||||||||||||||||||||||||||||||||||||||||||||||||||||||||||||||||||||||||||||||||
| FL-15 |  |
Dennis Ross | 2011 | 4th |
|
14.9% | 10.0% | |||||||||||||||||||||||||||||||||||||||||||||||||||||||||||||||||||||||||||||||||||||||||||
|
Incumbent not running for re-election in 2018.
|
||||||||||||||||||||||||||||||||||||||||||||||||||||||||||||||||||||||||||||||||||||||||||||||||||
| FL-16 |  |
Vern Buchanan | 2007 | 6th |
|
19.5% | 10.7% | |||||||||||||||||||||||||||||||||||||||||||||||||||||||||||||||||||||||||||||||||||||||||||
| FL-18 |  |
Brian Mast | 2017 | 1st |
|
10.5% | 9.2% | |||||||||||||||||||||||||||||||||||||||||||||||||||||||||||||||||||||||||||||||||||||||||||
| FL-25 |  |
Mario Diaz-Balart | 2003 | 8th |
|
24.7% | 1.8% | |||||||||||||||||||||||||||||||||||||||||||||||||||||||||||||||||||||||||||||||||||||||||||
| FL-26 | 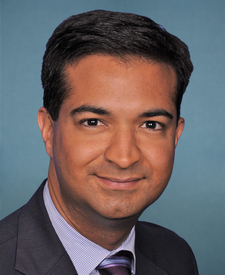 |
Carlos Curbelo | 2015 | 2nd |
|
11.8% | 16.3% | |||||||||||||||||||||||||||||||||||||||||||||||||||||||||||||||||||||||||||||||||||||||||||
| FL-27 | 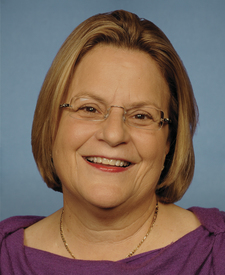 |
Ileana Ros-Lehtinen | 1989 | 15th |
|
9.8% | 19.6% | |||||||||||||||||||||||||||||||||||||||||||||||||||||||||||||||||||||||||||||||||||||||||||
|
Incumbent not running for re-election in 2018.
|
||||||||||||||||||||||||||||||||||||||||||||||||||||||||||||||||||||||||||||||||||||||||||||||||||
| FL-1 |  |
Matt Gaetz | 2017 | 1st |
|
38.2% | 39.3% | |||||||||||||||||||||||||||||||||||||||||||||||||||||||||||||||||||||||||||||||||||||||||||
| FL-2 | 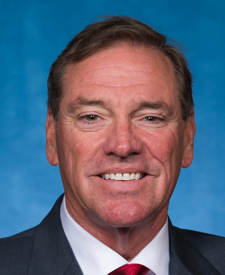 |
Neal Dunn | 2017 | 1st |
|
37.4% | 35.6% | |||||||||||||||||||||||||||||||||||||||||||||||||||||||||||||||||||||||||||||||||||||||||||
| FL-3 | 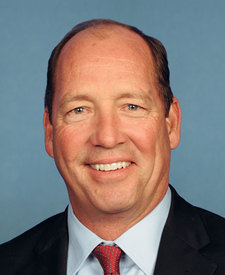 |
Ted Yoho | 2013 | 3rd |
|
16.8% | 16.0% | |||||||||||||||||||||||||||||||||||||||||||||||||||||||||||||||||||||||||||||||||||||||||||
| FL-4 | 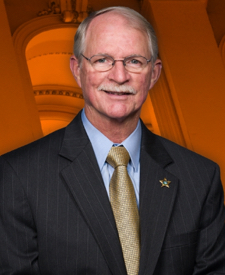 |
John Rutherford | 2017 | 1st |
|
42.6% | 28.0% | |||||||||||||||||||||||||||||||||||||||||||||||||||||||||||||||||||||||||||||||||||||||||||
| FL-5 | 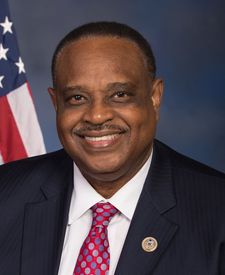 |
Al Lawson | 2017 | 1st |
|
28.5% | 25.4% | |||||||||||||||||||||||||||||||||||||||||||||||||||||||||||||||||||||||||||||||||||||||||||
| FL-8 | 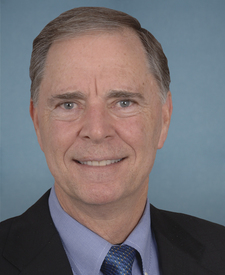 |
Bill Posey | 2009 | 5th |
|
30.6% | 20.7% | |||||||||||||||||||||||||||||||||||||||||||||||||||||||||||||||||||||||||||||||||||||||||||
| FL-9 | 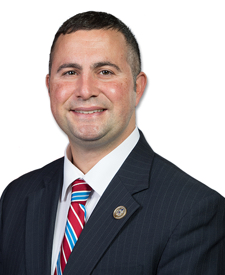 |
Darren Soto | 2017 | 1st |
|
15.0% | 12.9% | |||||||||||||||||||||||||||||||||||||||||||||||||||||||||||||||||||||||||||||||||||||||||||
| FL-10 | 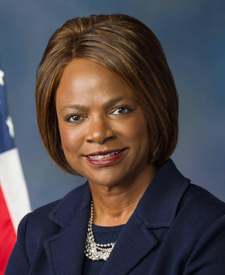 |
Val Demings | 2017 | 1st |
|
29.7% | 26.9% | |||||||||||||||||||||||||||||||||||||||||||||||||||||||||||||||||||||||||||||||||||||||||||
| FL-11 | 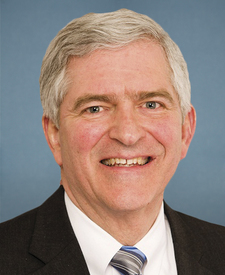 |
Dan Webster | 2017 | 1st |
|
33.8% | 32.3% | |||||||||||||||||||||||||||||||||||||||||||||||||||||||||||||||||||||||||||||||||||||||||||
| FL-12 | 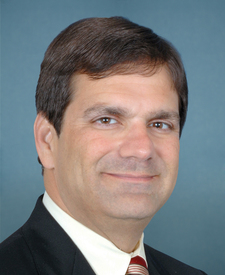 |
Gus Bilirakis | 2007 | 6th |
|
37.2% | 18.6% | |||||||||||||||||||||||||||||||||||||||||||||||||||||||||||||||||||||||||||||||||||||||||||
| FL-13 | 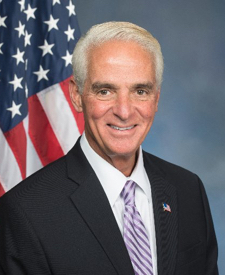 |
Charlie Crist | 2017 | 1st |
|
3.8% | 3.2% | |||||||||||||||||||||||||||||||||||||||||||||||||||||||||||||||||||||||||||||||||||||||||||
| FL-14 |  |
Kathy Castor | 2007 | 6th |
|
23.6% | 18.2% | |||||||||||||||||||||||||||||||||||||||||||||||||||||||||||||||||||||||||||||||||||||||||||
| FL-17 |  |
Thomas Rooney | 2009 | 5th |
|
27.6% | 27.2% | |||||||||||||||||||||||||||||||||||||||||||||||||||||||||||||||||||||||||||||||||||||||||||
|
Incumbent not running for re-election in 2018.
|
||||||||||||||||||||||||||||||||||||||||||||||||||||||||||||||||||||||||||||||||||||||||||||||||||
| FL-19 |  |
Francis Rooney | 2017 | 1st |
|
31.8% | 22.1% | |||||||||||||||||||||||||||||||||||||||||||||||||||||||||||||||||||||||||||||||||||||||||||
| FL-20 |  |
Alcee Hastings | 1993 | 13th |
|
60.6% | 62.1% | |||||||||||||||||||||||||||||||||||||||||||||||||||||||||||||||||||||||||||||||||||||||||||
| FL-21 | 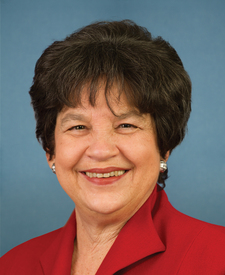 |
Lois Frankel | 2013 | 3rd |
|
17.9% | 15.8% | |||||||||||||||||||||||||||||||||||||||||||||||||||||||||||||||||||||||||||||||||||||||||||
| FL-22 | 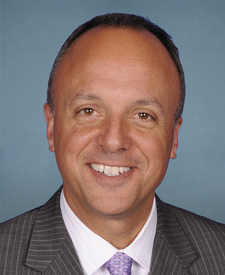 |
Ted Deutch | 2010 | 5th |
|
27.6% | 19.5% | |||||||||||||||||||||||||||||||||||||||||||||||||||||||||||||||||||||||||||||||||||||||||||
| FL-23 | 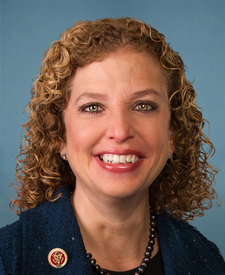 |
Debbie Wasserman Schultz | 2005 | 7th |
|
16.2% | 26.1% | |||||||||||||||||||||||||||||||||||||||||||||||||||||||||||||||||||||||||||||||||||||||||||
| FL-24 | 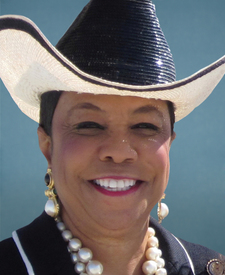 |
Frederica Wilson | 2011 | 4th |
|
* | 67.5% | |||||||||||||||||||||||||||||||||||||||||||||||||||||||||||||||||||||||||||||||||||||||||||
(a)Source: Ballotpedia (for margins). The margin is the percentage difference between the top two vote-getters in 2016.
More recent results (i.e., special elections held in 2017-18 for vacancies) are not displayed.
* Race was uncontested | ^Top two vote-getters were from the same party
(b)Source: Daily Kos. The margin is the percentage difference between Donald Trump and Hillary Clinton.

