2018 Illinois House Election Interactive Map
All US House seats to be contested in 2018
Illinois has 18 congressional districts. Eleven are held by Democrats, 7 by Republicans. All but one of the Democratic-held districts is in the Chicago area. Four of the 18 districts look to be competitive in 2018, all are held by Republicans.
To create your own forecast for the midterms, visit the 2018 House Interactive Map.

Hover over a district for details.
| District | Incumbent | Party | Since | Term | Predictions | Margin of Victory | ||||||||||||||||||||||||||||||||||||||||||||||||||||||||||||||||||||||||||||||||||||||||||||
|---|---|---|---|---|---|---|---|---|---|---|---|---|---|---|---|---|---|---|---|---|---|---|---|---|---|---|---|---|---|---|---|---|---|---|---|---|---|---|---|---|---|---|---|---|---|---|---|---|---|---|---|---|---|---|---|---|---|---|---|---|---|---|---|---|---|---|---|---|---|---|---|---|---|---|---|---|---|---|---|---|---|---|---|---|---|---|---|---|---|---|---|---|---|---|---|---|---|---|
| Pro | Map | House(a) | President(b) | |||||||||||||||||||||||||||||||||||||||||||||||||||||||||||||||||||||||||||||||||||||||||||||||
| IL-6 |  |
Peter Roskam | 2007 | 6th |
|
18.4% | 7.0% | |||||||||||||||||||||||||||||||||||||||||||||||||||||||||||||||||||||||||||||||||||||||||||
| IL-12 |  |
Mike Bost | 2015 | 2nd |
|
14.6% | 14.8% | |||||||||||||||||||||||||||||||||||||||||||||||||||||||||||||||||||||||||||||||||||||||||||
| IL-13 |  |
Rodney Davis | 2013 | 3rd |
|
19.3% | 5.5% | |||||||||||||||||||||||||||||||||||||||||||||||||||||||||||||||||||||||||||||||||||||||||||
| IL-14 |  |
Randy Hultgren | 2011 | 4th |
|
18.6% | 3.9% | |||||||||||||||||||||||||||||||||||||||||||||||||||||||||||||||||||||||||||||||||||||||||||
| IL-1 | 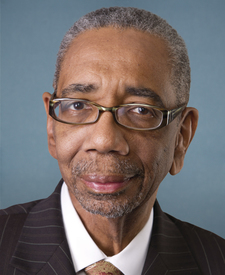 |
Bobby Rush | 1993 | 13th |
|
48.2% | 54.0% | |||||||||||||||||||||||||||||||||||||||||||||||||||||||||||||||||||||||||||||||||||||||||||
| IL-2 | 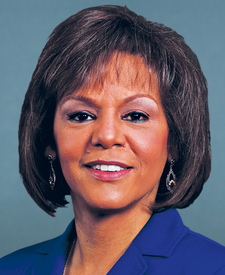 |
Robin Kelly | 2013 | 3rd |
|
59.6% | 58.9% | |||||||||||||||||||||||||||||||||||||||||||||||||||||||||||||||||||||||||||||||||||||||||||
| IL-3 | 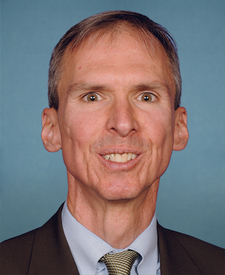 |
Daniel Lipinski | 2005 | 7th |
|
* | 15.3% | |||||||||||||||||||||||||||||||||||||||||||||||||||||||||||||||||||||||||||||||||||||||||||
| IL-4 | 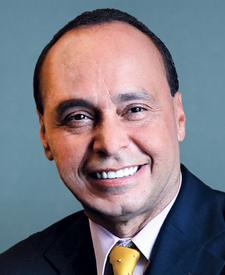 |
Luis Gutierrez | 1993 | 13th |
|
* | 68.9% | |||||||||||||||||||||||||||||||||||||||||||||||||||||||||||||||||||||||||||||||||||||||||||
|
Incumbent not running for re-election in 2018.
|
||||||||||||||||||||||||||||||||||||||||||||||||||||||||||||||||||||||||||||||||||||||||||||||||||
| IL-5 |  |
Mike Quigley | 2009 | 5th |
|
40.4% | 46.6% | |||||||||||||||||||||||||||||||||||||||||||||||||||||||||||||||||||||||||||||||||||||||||||
| IL-7 |  |
Danny Davis | 1997 | 11th |
|
68.5% | 78.2% | |||||||||||||||||||||||||||||||||||||||||||||||||||||||||||||||||||||||||||||||||||||||||||
| IL-8 |  |
Raja Krishnamoorthi | 2017 | 1st |
|
16.6% | 21.7% | |||||||||||||||||||||||||||||||||||||||||||||||||||||||||||||||||||||||||||||||||||||||||||
| IL-9 |  |
Janice Schakowsky | 1999 | 10th |
|
33.0% | 45.2% | |||||||||||||||||||||||||||||||||||||||||||||||||||||||||||||||||||||||||||||||||||||||||||
| IL-10 |  |
Brad Schneider | 2017 | 1st |
|
5.2% | 29.4% | |||||||||||||||||||||||||||||||||||||||||||||||||||||||||||||||||||||||||||||||||||||||||||
| IL-11 |  |
Bill Foster | 2013 | 3rd |
|
20.9% | 23.5% | |||||||||||||||||||||||||||||||||||||||||||||||||||||||||||||||||||||||||||||||||||||||||||
| IL-15 | 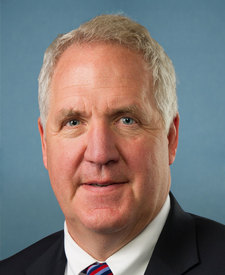 |
John Shimkus | 1997 | 11th |
|
* | 46.2% | |||||||||||||||||||||||||||||||||||||||||||||||||||||||||||||||||||||||||||||||||||||||||||
| IL-16 | 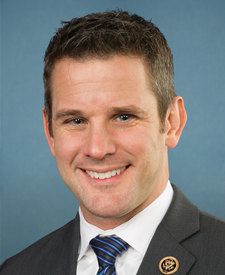 |
Adam Kinzinger | 2011 | 4th |
|
* | 17.2% | |||||||||||||||||||||||||||||||||||||||||||||||||||||||||||||||||||||||||||||||||||||||||||
| IL-17 | 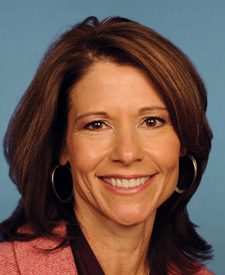 |
Cheri Bustos | 2013 | 3rd |
|
20.6% | 0.6% | |||||||||||||||||||||||||||||||||||||||||||||||||||||||||||||||||||||||||||||||||||||||||||
| IL-18 | 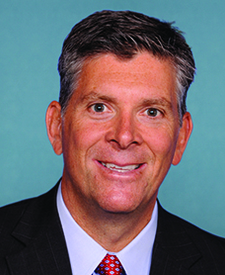 |
Darin LaHood | 2015 | 2nd |
|
44.3% | 27.3% | |||||||||||||||||||||||||||||||||||||||||||||||||||||||||||||||||||||||||||||||||||||||||||
(a)Source: Ballotpedia (for margins). The margin is the percentage difference between the top two vote-getters in 2016.
More recent results (i.e., special elections held in 2017-18 for vacancies) are not displayed.
* Race was uncontested | ^Top two vote-getters were from the same party
(b)Source: Daily Kos. The margin is the percentage difference between Donald Trump and Hillary Clinton.

