2018 Michigan House Election Interactive Map
All US House seats to be contested in 2018
Michigan has 14 congressional districts. There are nine Republicans, four Democrats and one vacancy. The open seat was previously held by John Conyers, Jr., who resigned in late 2017. That safe Democratic seat will be filled by special election on the same day as the midterms, November 6, 2018. Only two seats, MI-08 and MI-11 look to be highly competitive in 2018, although three other Republican-held seats will need to be watched if the Democrats have a very good night.
To create your own forecast for the midterms, visit the 2018 House Interactive Map.

Hover over a district for details.
| District | Incumbent | Party | Since | Term | Predictions | Margin of Victory | ||||||||||||||||||||||||||||||||||||||||||||||||||||||||||||||||||||||||||||||||||||||||||||
|---|---|---|---|---|---|---|---|---|---|---|---|---|---|---|---|---|---|---|---|---|---|---|---|---|---|---|---|---|---|---|---|---|---|---|---|---|---|---|---|---|---|---|---|---|---|---|---|---|---|---|---|---|---|---|---|---|---|---|---|---|---|---|---|---|---|---|---|---|---|---|---|---|---|---|---|---|---|---|---|---|---|---|---|---|---|---|---|---|---|---|---|---|---|---|---|---|---|---|
| Pro | Map | House(a) | President(b) | |||||||||||||||||||||||||||||||||||||||||||||||||||||||||||||||||||||||||||||||||||||||||||||||
| MI-1 |  |
Jack Bergman | 2017 | 1st |
|
14.8% | 21.3% | |||||||||||||||||||||||||||||||||||||||||||||||||||||||||||||||||||||||||||||||||||||||||||
| MI-2 |  |
Bill Huizenga | 2011 | 4th |
|
30.1% | 17.6% | |||||||||||||||||||||||||||||||||||||||||||||||||||||||||||||||||||||||||||||||||||||||||||
| MI-3 | 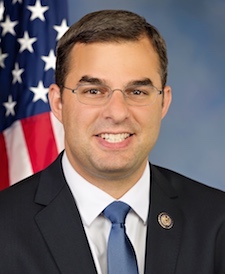 |
Justin Amash | 2011 | 4th |
|
21.9% | 9.4% | |||||||||||||||||||||||||||||||||||||||||||||||||||||||||||||||||||||||||||||||||||||||||||
| MI-6 |  |
Fred Upton | 1987 | 16th |
|
22.2% | 8.4% | |||||||||||||||||||||||||||||||||||||||||||||||||||||||||||||||||||||||||||||||||||||||||||
| MI-7 | 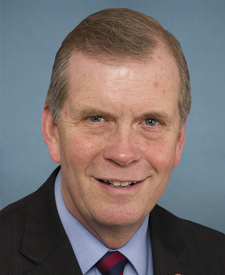 |
Tim Walberg | 2011 | 4th |
|
15.0% | 17.0% | |||||||||||||||||||||||||||||||||||||||||||||||||||||||||||||||||||||||||||||||||||||||||||
| MI-8 | 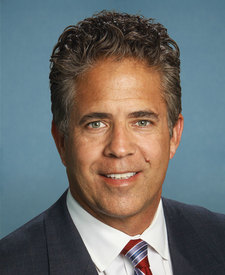 |
Mike Bishop | 2015 | 2nd |
|
16.9% | 6.7% | |||||||||||||||||||||||||||||||||||||||||||||||||||||||||||||||||||||||||||||||||||||||||||
| MI-11 |  |
Dave Trott | 2015 | 2nd |
|
12.8% | 4.4% | |||||||||||||||||||||||||||||||||||||||||||||||||||||||||||||||||||||||||||||||||||||||||||
|
Incumbent not running for re-election in 2018.
|
||||||||||||||||||||||||||||||||||||||||||||||||||||||||||||||||||||||||||||||||||||||||||||||||||
| MI-4 |  |
John Moolenaar | 2015 | 2nd |
|
29.5% | 24.8% | |||||||||||||||||||||||||||||||||||||||||||||||||||||||||||||||||||||||||||||||||||||||||||
| MI-5 | 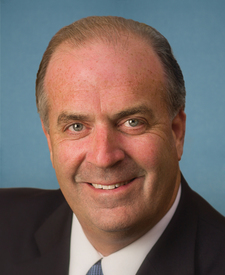 |
Daniel Kildee | 2013 | 3rd |
|
26.1% | 4.2% | |||||||||||||||||||||||||||||||||||||||||||||||||||||||||||||||||||||||||||||||||||||||||||
| MI-9 | 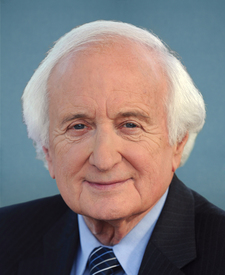 |
Sander Levin | 1983 | 18th |
|
20.5% | 7.8% | |||||||||||||||||||||||||||||||||||||||||||||||||||||||||||||||||||||||||||||||||||||||||||
|
Incumbent not running for re-election in 2018.
|
||||||||||||||||||||||||||||||||||||||||||||||||||||||||||||||||||||||||||||||||||||||||||||||||||
| MI-10 | 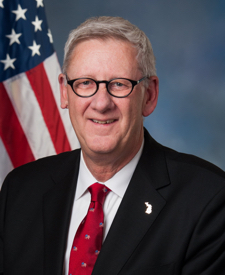 |
Paul Mitchell | 2017 | 1st |
|
30.8% | 32.2% | |||||||||||||||||||||||||||||||||||||||||||||||||||||||||||||||||||||||||||||||||||||||||||
| MI-12 | 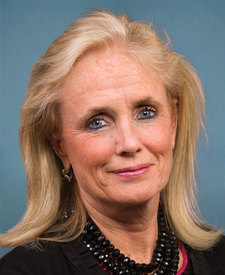 |
Debbie Dingell | 2015 | 2nd |
|
35.1% | 26.3% | |||||||||||||||||||||||||||||||||||||||||||||||||||||||||||||||||||||||||||||||||||||||||||
| MI-13 |  |
Brenda Jones | 2018 | 1st |
|
61.4% | 60.7% | |||||||||||||||||||||||||||||||||||||||||||||||||||||||||||||||||||||||||||||||||||||||||||
| MI-14 |  |
Brenda Lawrence | 2015 | 2nd |
|
59.8% | 60.9% | |||||||||||||||||||||||||||||||||||||||||||||||||||||||||||||||||||||||||||||||||||||||||||
(a)Source: Ballotpedia (for margins). The margin is the percentage difference between the top two vote-getters in 2016.
More recent results (i.e., special elections held in 2017-18 for vacancies) are not displayed.
* Race was uncontested | ^Top two vote-getters were from the same party
(b)Source: Daily Kos. The margin is the percentage difference between Donald Trump and Hillary Clinton.

