2018 Oklahoma House Election Interactive Map
All US House seats to be contested in 2018
Oklahoma has five congressional districts; four of which are held by Republicans. There is one vacancy in OK-1. In lieu of a special election, the winner of the general election for that district in November will be appointed to serve out the remainder of this term. Ignoring the vacancy, Oklahoma is the state with the largest number of districts under 100% Republican control. OK-5, which includes Oklahoma City, is the only one that has a chance to become competitive.
To create your own forecast for the midterms, visit the 2018 House Interactive Map.

Hover over a district for details.
| District | Incumbent | Party | Since | Term | Predictions | Margin of Victory | ||||||||||||||||||||||||||||||||||||||||||||||||||||||||||||||||||||||||||||||||||||||||||||
|---|---|---|---|---|---|---|---|---|---|---|---|---|---|---|---|---|---|---|---|---|---|---|---|---|---|---|---|---|---|---|---|---|---|---|---|---|---|---|---|---|---|---|---|---|---|---|---|---|---|---|---|---|---|---|---|---|---|---|---|---|---|---|---|---|---|---|---|---|---|---|---|---|---|---|---|---|---|---|---|---|---|---|---|---|---|---|---|---|---|---|---|---|---|---|---|---|---|---|
| Pro | Map | House(a) | President(b) | |||||||||||||||||||||||||||||||||||||||||||||||||||||||||||||||||||||||||||||||||||||||||||||||
| OK-5 |  |
Steve Russell | 2015 | 2nd |
|
20.3% | 13.4% | |||||||||||||||||||||||||||||||||||||||||||||||||||||||||||||||||||||||||||||||||||||||||||
| OK-1 |  |
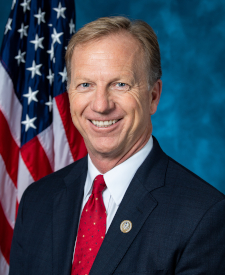
Kevin Hern | 2018 | 1st |
|
* | 28.7% | |||||||||||||||||||||||||||||||||||||||||||||||||||||||||||||||||||||||||||||||||||||||||||
| OK-2 |  |
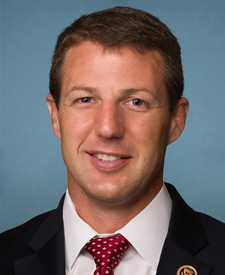
Markwayne Mullin | 2013 | 3rd |
|
47.4% | 50.1% | |||||||||||||||||||||||||||||||||||||||||||||||||||||||||||||||||||||||||||||||||||||||||||
| OK-3 |  |
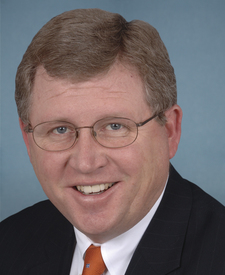
Frank Lucas | 1994 | 13th |
|
56.6% | 52.7% | |||||||||||||||||||||||||||||||||||||||||||||||||||||||||||||||||||||||||||||||||||||||||||
| OK-4 |  |
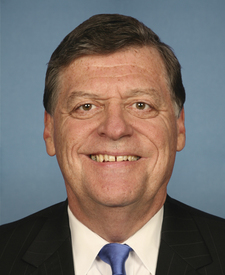
Tom Cole | 2003 | 8th |
|
43.5% | 37.4% | |||||||||||||||||||||||||||||||||||||||||||||||||||||||||||||||||||||||||||||||||||||||||||
(a)Source: Ballotpedia (for margins). The margin is the percentage difference between the top two vote-getters in 2016.
More recent results (i.e., special elections held in 2017-18 for vacancies) are not displayed.
* Race was uncontested | ^Top two vote-getters were from the same party
(b)Source: Daily Kos. The margin is the percentage difference between Donald Trump and Hillary Clinton.

