2018 Texas House Election Interactive Map
All US House seats to be contested in 2018
Texas has 36 congressional districts, trailing only California (53), for the most in the country. There are 25 Republicans and 11 Democrats in the delegation). Seven of the 36 (5 Republicans, 2 Democrats) are not seeking reelection. All are retiring, except Democrat Beto O'Rourke, who is challenging Ted Cruz in the 2018 U.S. Senate race. Several GOP-held suburban-area districts have become increasingly competitive as 2018 has progressed.
To create your own forecast for the midterms, visit the 2018 House Interactive Map.

Hover over a district for details.
| District | Incumbent | Party | Since | Term | Predictions | Margin of Victory | ||||||||||||||||||||||||||||||||||||||||||||||||||||||||||||||||||||||||||||||||||||||||||||
|---|---|---|---|---|---|---|---|---|---|---|---|---|---|---|---|---|---|---|---|---|---|---|---|---|---|---|---|---|---|---|---|---|---|---|---|---|---|---|---|---|---|---|---|---|---|---|---|---|---|---|---|---|---|---|---|---|---|---|---|---|---|---|---|---|---|---|---|---|---|---|---|---|---|---|---|---|---|---|---|---|---|---|---|---|---|---|---|---|---|---|---|---|---|---|---|---|---|---|
| Pro | Map | House(a) | President(b) | |||||||||||||||||||||||||||||||||||||||||||||||||||||||||||||||||||||||||||||||||||||||||||||||
| TX-2 | 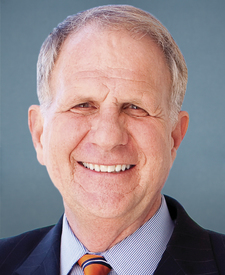 |
Ted Poe | 2005 | 7th |
|
24.6% | 9.3% | |||||||||||||||||||||||||||||||||||||||||||||||||||||||||||||||||||||||||||||||||||||||||||
|
Incumbent not running for re-election in 2018.
|
||||||||||||||||||||||||||||||||||||||||||||||||||||||||||||||||||||||||||||||||||||||||||||||||||
| TX-6 | 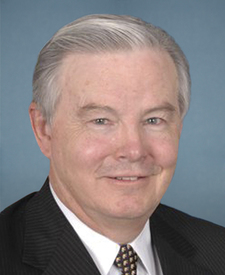 |
Joe Barton | 1985 | 17th |
|
19.3% | 12.3% | |||||||||||||||||||||||||||||||||||||||||||||||||||||||||||||||||||||||||||||||||||||||||||
|
Incumbent not running for re-election in 2018.
|
||||||||||||||||||||||||||||||||||||||||||||||||||||||||||||||||||||||||||||||||||||||||||||||||||
| TX-7 | 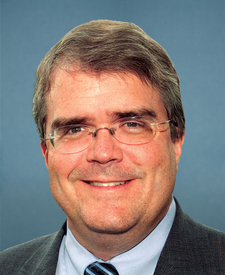 |
John Culberson | 2001 | 9th |
|
12.3% | 1.4% | |||||||||||||||||||||||||||||||||||||||||||||||||||||||||||||||||||||||||||||||||||||||||||
| TX-10 | 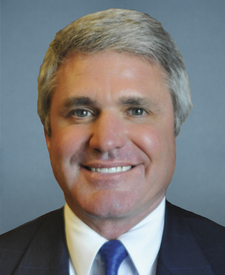 |
Michael McCaul | 2005 | 7th |
|
18.9% | 9.0% | |||||||||||||||||||||||||||||||||||||||||||||||||||||||||||||||||||||||||||||||||||||||||||
| TX-21 | 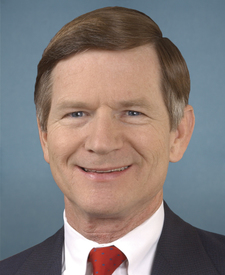 |
Lamar Smith | 1987 | 16th |
|
20.6% | 10.0% | |||||||||||||||||||||||||||||||||||||||||||||||||||||||||||||||||||||||||||||||||||||||||||
|
Incumbent not running for re-election in 2018.
|
||||||||||||||||||||||||||||||||||||||||||||||||||||||||||||||||||||||||||||||||||||||||||||||||||
| TX-22 | 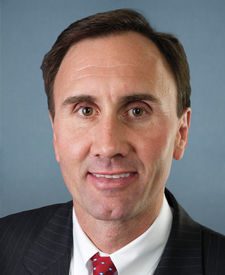 |
Pete Olson | 2009 | 5th |
|
19.0% | 7.9% | |||||||||||||||||||||||||||||||||||||||||||||||||||||||||||||||||||||||||||||||||||||||||||
| TX-23 | 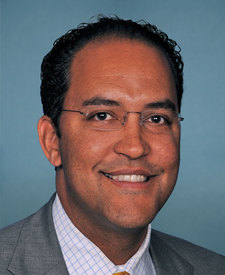 |
Will Hurd | 2015 | 2nd |
|
1.3% | 3.4% | |||||||||||||||||||||||||||||||||||||||||||||||||||||||||||||||||||||||||||||||||||||||||||
| TX-24 | 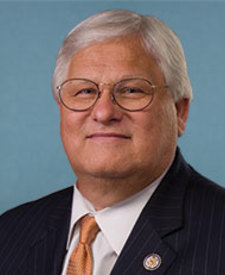 |
Kenny Marchant | 2005 | 7th |
|
16.9% | 6.2% | |||||||||||||||||||||||||||||||||||||||||||||||||||||||||||||||||||||||||||||||||||||||||||
| TX-31 | 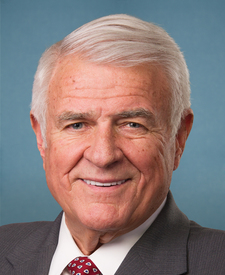 |
John Carter | 2003 | 8th |
|
21.9% | 12.7% | |||||||||||||||||||||||||||||||||||||||||||||||||||||||||||||||||||||||||||||||||||||||||||
| TX-32 | 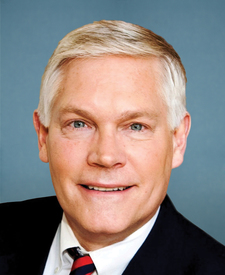 |
Pete Sessions | 1997 | 11th |
|
52.1% | 1.9% | |||||||||||||||||||||||||||||||||||||||||||||||||||||||||||||||||||||||||||||||||||||||||||
| TX-1 |  |
Louie Gohmert | 2005 | 7th |
|
49.8% | 46.9% | |||||||||||||||||||||||||||||||||||||||||||||||||||||||||||||||||||||||||||||||||||||||||||
| TX-3 | 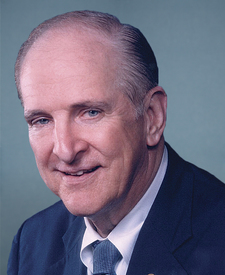 |
Sam Johnson | 1991 | 14th |
|
26.6% | 14.2% | |||||||||||||||||||||||||||||||||||||||||||||||||||||||||||||||||||||||||||||||||||||||||||
|
Incumbent not running for re-election in 2018.
|
||||||||||||||||||||||||||||||||||||||||||||||||||||||||||||||||||||||||||||||||||||||||||||||||||
| TX-4 |  |
John Ratcliffe | 2015 | 2nd |
|
76.0% | 53.6% | |||||||||||||||||||||||||||||||||||||||||||||||||||||||||||||||||||||||||||||||||||||||||||
| TX-5 | 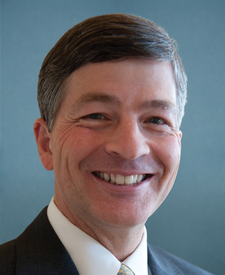 |
Jeb Hensarling | 2003 | 8th |
|
61.2% | 28.4% | |||||||||||||||||||||||||||||||||||||||||||||||||||||||||||||||||||||||||||||||||||||||||||
|
Incumbent not running for re-election in 2018.
|
||||||||||||||||||||||||||||||||||||||||||||||||||||||||||||||||||||||||||||||||||||||||||||||||||
| TX-8 | 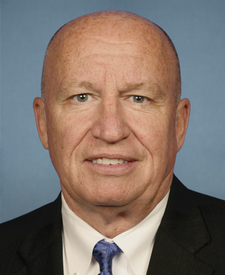 |
Kevin Brady | 1997 | 11th |
|
* | 48.8% | |||||||||||||||||||||||||||||||||||||||||||||||||||||||||||||||||||||||||||||||||||||||||||
| TX-9 | 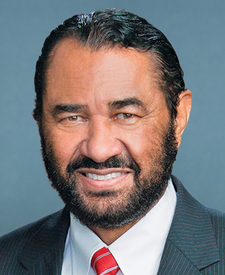 |
Al Green | 2005 | 7th |
|
54.8% | 61.3% | |||||||||||||||||||||||||||||||||||||||||||||||||||||||||||||||||||||||||||||||||||||||||||
| TX-11 | 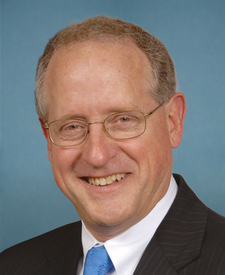 |
K. Michael Conaway | 2005 | 7th |
|
79.0% | 58.7% | |||||||||||||||||||||||||||||||||||||||||||||||||||||||||||||||||||||||||||||||||||||||||||
| TX-12 | 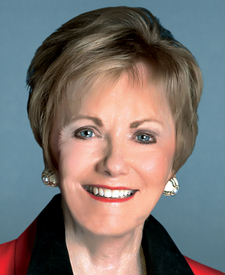 |
Kay Granger | 1997 | 11th |
|
42.5% | 30.2% | |||||||||||||||||||||||||||||||||||||||||||||||||||||||||||||||||||||||||||||||||||||||||||
| TX-13 |  |
Mac Thornberry | 1995 | 12th |
|
83.3% | 63.0% | |||||||||||||||||||||||||||||||||||||||||||||||||||||||||||||||||||||||||||||||||||||||||||
| TX-14 |  |
Randy Weber | 2013 | 3rd |
|
23.7% | 19.8% | |||||||||||||||||||||||||||||||||||||||||||||||||||||||||||||||||||||||||||||||||||||||||||
| TX-15 |  |
Vicente Gonzalez | 2017 | 1st |
|
19.6% | 16.7% | |||||||||||||||||||||||||||||||||||||||||||||||||||||||||||||||||||||||||||||||||||||||||||
| TX-16 |  |
Beto O'Rourke | 2013 | 3rd |
|
75.8% | 40.7% | |||||||||||||||||||||||||||||||||||||||||||||||||||||||||||||||||||||||||||||||||||||||||||
|
Incumbent not running for re-election in 2018.
|
||||||||||||||||||||||||||||||||||||||||||||||||||||||||||||||||||||||||||||||||||||||||||||||||||
| TX-17 |  |
Bill Flores | 2011 | 4th |
|
25.6% | 17.5% | |||||||||||||||||||||||||||||||||||||||||||||||||||||||||||||||||||||||||||||||||||||||||||
| TX-18 | 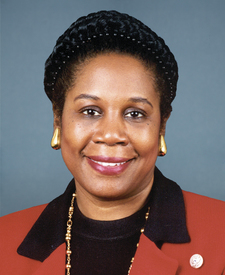 |
Sheila Jackson-Lee | 1995 | 12th |
|
49.9% | 56.5% | |||||||||||||||||||||||||||||||||||||||||||||||||||||||||||||||||||||||||||||||||||||||||||
| TX-19 |  |
Jodey Arrington | 2017 | 1st |
|
78.1% | 49.0% | |||||||||||||||||||||||||||||||||||||||||||||||||||||||||||||||||||||||||||||||||||||||||||
| TX-20 | 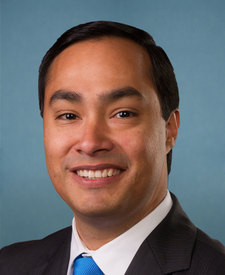 |
Joaquin Castro | 2013 | 3rd |
|
64.3% | 26.7% | |||||||||||||||||||||||||||||||||||||||||||||||||||||||||||||||||||||||||||||||||||||||||||
| TX-25 | 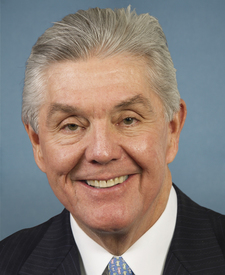 |
Roger Williams | 2013 | 3rd |
|
20.6% | 14.9% | |||||||||||||||||||||||||||||||||||||||||||||||||||||||||||||||||||||||||||||||||||||||||||
| TX-26 | 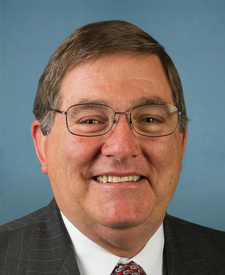 |
Michael Burgess | 2003 | 8th |
|
36.7% | 26.5% | |||||||||||||||||||||||||||||||||||||||||||||||||||||||||||||||||||||||||||||||||||||||||||
| TX-27 |  |
Michael Cloud | 2018 | 1st |
|
23.4% | 23.6% | |||||||||||||||||||||||||||||||||||||||||||||||||||||||||||||||||||||||||||||||||||||||||||
| TX-28 | 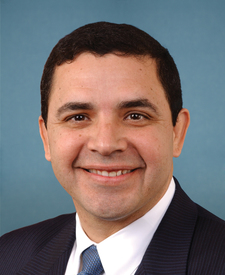 |
Henry Cuellar | 2005 | 7th |
|
34.9% | 19.8% | |||||||||||||||||||||||||||||||||||||||||||||||||||||||||||||||||||||||||||||||||||||||||||
| TX-29 | 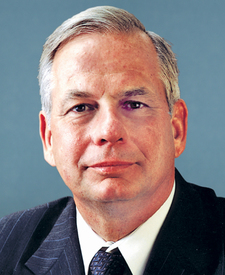 |
Gene Green | 1993 | 13th |
|
48.5% | 45.7% | |||||||||||||||||||||||||||||||||||||||||||||||||||||||||||||||||||||||||||||||||||||||||||
|
Incumbent not running for re-election in 2018.
|
||||||||||||||||||||||||||||||||||||||||||||||||||||||||||||||||||||||||||||||||||||||||||||||||||
| TX-30 |  |
Eddie Johnson | 1993 | 13th |
|
58.9% | 60.8% | |||||||||||||||||||||||||||||||||||||||||||||||||||||||||||||||||||||||||||||||||||||||||||
| TX-33 | 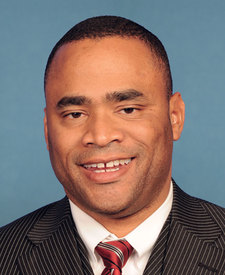 |
Marc Veasey | 2013 | 3rd |
|
47.4% | 49.2% | |||||||||||||||||||||||||||||||||||||||||||||||||||||||||||||||||||||||||||||||||||||||||||
| TX-34 | 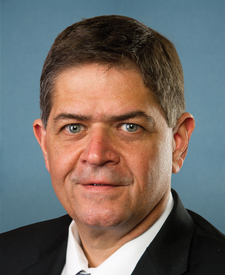 |
Filemon Vela | 2013 | 3rd |
|
25.3% | 21.5% | |||||||||||||||||||||||||||||||||||||||||||||||||||||||||||||||||||||||||||||||||||||||||||
| TX-35 |  |
Lloyd Doggett | 1995 | 12th |
|
31.5% | 33.6% | |||||||||||||||||||||||||||||||||||||||||||||||||||||||||||||||||||||||||||||||||||||||||||
| TX-36 |  |
Brian Babin | 2015 | 2nd |
|
77.2% | 46.8% | |||||||||||||||||||||||||||||||||||||||||||||||||||||||||||||||||||||||||||||||||||||||||||
(a)Source: Ballotpedia (for margins). The margin is the percentage difference between the top two vote-getters in 2016.
More recent results (i.e., special elections held in 2017-18 for vacancies) are not displayed.
* Race was uncontested | ^Top two vote-getters were from the same party
(b)Source: Daily Kos. The margin is the percentage difference between Donald Trump and Hillary Clinton.

