2020 Colorado House Election Interactive Map
All US House seats to be contested in 2020
Colorado has seven congressional districts. Democrats hold a 4-3 edge after gaining a seat in 2018.
2020 will be the final election with this map, as redistricting will occur in 2021 after the 2020 Census. Colorado is expected to gain a congressional district. The new district boundaries will be first contested in the 2022 election.
To create and share your own forecast, visit the 2020 House Interactive Map.

Hover over a district for details.
| District | Incumbent | Party | Since | Term | Predictions | Margin of Victory | ||||||||||||||||||||||||||||||||||||||||||||||||||||||||||||||||||||||||||||||||||||||||||||
|---|---|---|---|---|---|---|---|---|---|---|---|---|---|---|---|---|---|---|---|---|---|---|---|---|---|---|---|---|---|---|---|---|---|---|---|---|---|---|---|---|---|---|---|---|---|---|---|---|---|---|---|---|---|---|---|---|---|---|---|---|---|---|---|---|---|---|---|---|---|---|---|---|---|---|---|---|---|---|---|---|---|---|---|---|---|---|---|---|---|---|---|---|---|---|---|---|---|---|
| Pro | Map | House(a) | President(b) | |||||||||||||||||||||||||||||||||||||||||||||||||||||||||||||||||||||||||||||||||||||||||||||||
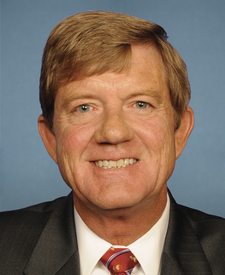
| CO-3 |  |
Scott Tipton | 2011 | 5th |
|
7.9% | 12.0% | |||||||||||||||||||||||||||||||||||||||||||||||||||||||||||||||||||||||||||||||||||||||||||
|
Incumbent defeated in primary for 2020 election.
Diane Bush
Lauren Boebert
|
||||||||||||||||||||||||||||||||||||||||||||||||||||||||||||||||||||||||||||||||||||||||||||||||||
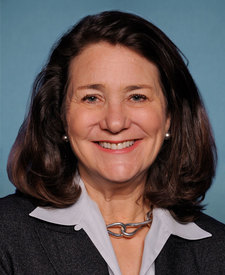
| CO-1 |  |
Diana DeGette | 1997 | 12th |
|
50.7% | 45.8% | |||||||||||||||||||||||||||||||||||||||||||||||||||||||||||||||||||||||||||||||||||||||||||
|
Diana Degette*
shane Bolling
|
||||||||||||||||||||||||||||||||||||||||||||||||||||||||||||||||||||||||||||||||||||||||||||||||||
| CO-2 |  |
Joe Neguse | 2019 | 1st |
|
26.6% | 21.3% | |||||||||||||||||||||||||||||||||||||||||||||||||||||||||||||||||||||||||||||||||||||||||||
|
Joe Neguse*
Charlie Winn
|
||||||||||||||||||||||||||||||||||||||||||||||||||||||||||||||||||||||||||||||||||||||||||||||||||
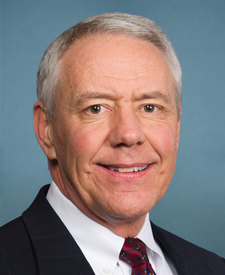
| CO-4 |  |
Ken Buck | 2015 | 3rd |
|
21.2% | 23.1% | |||||||||||||||||||||||||||||||||||||||||||||||||||||||||||||||||||||||||||||||||||||||||||
|
Ike McCorkle
Ken Buck*
|
||||||||||||||||||||||||||||||||||||||||||||||||||||||||||||||||||||||||||||||||||||||||||||||||||
| CO-5 |  |
Doug Lamborn | 2007 | 7th |
|
17.7% | 24.0% | |||||||||||||||||||||||||||||||||||||||||||||||||||||||||||||||||||||||||||||||||||||||||||
|
Jillian Freeland
Doug Lamborn*
|
||||||||||||||||||||||||||||||||||||||||||||||||||||||||||||||||||||||||||||||||||||||||||||||||||
| CO-6 |  |
Jason Crow | 2019 | 1st |
|
11.2% | 8.9% | |||||||||||||||||||||||||||||||||||||||||||||||||||||||||||||||||||||||||||||||||||||||||||
|
Jason Crow*
Steve House
|
||||||||||||||||||||||||||||||||||||||||||||||||||||||||||||||||||||||||||||||||||||||||||||||||||
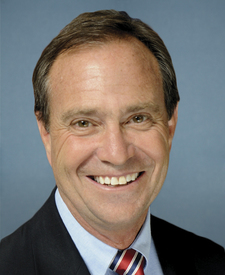
| CO-7 |  |
Ed Perlmutter | 2007 | 7th |
|
25.0% | 12.0% | |||||||||||||||||||||||||||||||||||||||||||||||||||||||||||||||||||||||||||||||||||||||||||
|
Ed Perlmutter*
Casper Stockham
|
||||||||||||||||||||||||||||||||||||||||||||||||||||||||||||||||||||||||||||||||||||||||||||||||||
(a)Source: Daily Kos, 270toWin research. The margin is the percentage difference between the top two vote-getters in 2018.
More recent results (i.e., special elections held in 2019-20 for vacancies) are not displayed.
† Race was uncontested | ^Top two vote-getters were from the same party
(b)Source: Daily Kos. The margin is the percentage difference between Donald Trump and Hillary Clinton.

