2020 Connecticut House Election Interactive Map
All US House seats to be contested in 2020
Connecticut has five congressional districts, all held by Democrats. None of the districts are seen as competitive for the GOP in 2020.
Redistricting will occur in 2021, after the 2020 Census. While the state is expected to maintain its five congressional districts, expect some changes to the district boundaries that will be effective with the 2022 election.
To create and share your own forecast, visit the 2020 House Interactive Map.

Hover over a district for details.
| District | Incumbent | Party | Since | Term | Predictions | Margin of Victory | ||||||||||||||||||||||||||||||||||||||||||||||||||||||||||||||||||||||||||||||||||||||||||||
|---|---|---|---|---|---|---|---|---|---|---|---|---|---|---|---|---|---|---|---|---|---|---|---|---|---|---|---|---|---|---|---|---|---|---|---|---|---|---|---|---|---|---|---|---|---|---|---|---|---|---|---|---|---|---|---|---|---|---|---|---|---|---|---|---|---|---|---|---|---|---|---|---|---|---|---|---|---|---|---|---|---|---|---|---|---|---|---|---|---|---|---|---|---|---|---|---|---|---|
| Pro | Map | House(a) | President(b) | |||||||||||||||||||||||||||||||||||||||||||||||||||||||||||||||||||||||||||||||||||||||||||||||
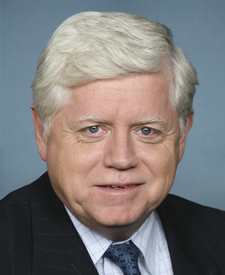
| CT-1 |  |
John Larson | 1999 | 11th |
|
28.8% | 23.1% | |||||||||||||||||||||||||||||||||||||||||||||||||||||||||||||||||||||||||||||||||||||||||||
|
John B Larson*
Mary Fay
|
||||||||||||||||||||||||||||||||||||||||||||||||||||||||||||||||||||||||||||||||||||||||||||||||||
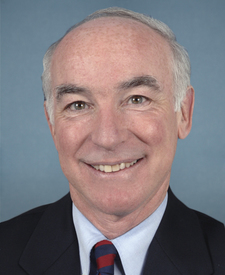
| CT-2 |  |
Joe Courtney | 2007 | 7th |
|
26.7% | 2.9% | |||||||||||||||||||||||||||||||||||||||||||||||||||||||||||||||||||||||||||||||||||||||||||
|
Joe Courtney*
Justin Anderson
|
||||||||||||||||||||||||||||||||||||||||||||||||||||||||||||||||||||||||||||||||||||||||||||||||||
| CT-3 |  |
Rosa DeLauro | 1991 | 15th |
|
29.1% | 15.5% | |||||||||||||||||||||||||||||||||||||||||||||||||||||||||||||||||||||||||||||||||||||||||||
|
Rosa L DeLauro*
Margaret Streicker
|
||||||||||||||||||||||||||||||||||||||||||||||||||||||||||||||||||||||||||||||||||||||||||||||||||
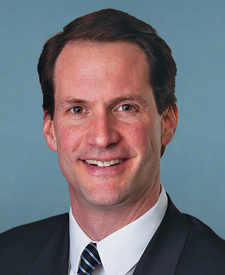
| CT-4 |  |
James Himes | 2009 | 6th |
|
22.4% | 23.0% | |||||||||||||||||||||||||||||||||||||||||||||||||||||||||||||||||||||||||||||||||||||||||||
|
Jim Himes*
Jonathan Riddle
|
||||||||||||||||||||||||||||||||||||||||||||||||||||||||||||||||||||||||||||||||||||||||||||||||||
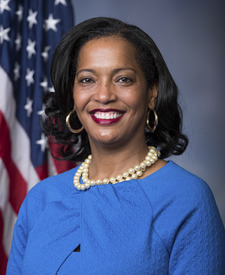
| CT-5 |  |
Jahana Hayes | 2019 | 1st |
|
11.7% | 4.1% | |||||||||||||||||||||||||||||||||||||||||||||||||||||||||||||||||||||||||||||||||||||||||||
|
Jahana Hayes*
David Sullivan
|
||||||||||||||||||||||||||||||||||||||||||||||||||||||||||||||||||||||||||||||||||||||||||||||||||
(a)Source: Daily Kos, 270toWin research. The margin is the percentage difference between the top two vote-getters in 2018.
More recent results (i.e., special elections held in 2019-20 for vacancies) are not displayed.
† Race was uncontested | ^Top two vote-getters were from the same party
(b)Source: Daily Kos. The margin is the percentage difference between Donald Trump and Hillary Clinton.

