2020 New Jersey House Election Interactive Map
All US House seats to be contested in 2020
New Jersey has 12 congressional districts. After flipping four GOP seats in 2018, Democrats held all but one of the seats. However, Jeff Van Drew (NJ-2) switched party allegience in 2019, making the current count 10-2.
Redistricting will occur in 2021 after the 2020 Census. While New Jersey is expected to maintain its 12 congressional districts, expect some changes to the district boundaries that will be effective with the 2022 election.
To create and share your own forecast, visit the 2020 House Interactive Map.

Hover over a district for details.
| District | Incumbent | Party | Since | Term | Predictions | Margin of Victory | ||||||||||||||||||||||||||||||||||||||||||||||||||||||||||||||||||||||||||||||||||||||||||||
|---|---|---|---|---|---|---|---|---|---|---|---|---|---|---|---|---|---|---|---|---|---|---|---|---|---|---|---|---|---|---|---|---|---|---|---|---|---|---|---|---|---|---|---|---|---|---|---|---|---|---|---|---|---|---|---|---|---|---|---|---|---|---|---|---|---|---|---|---|---|---|---|---|---|---|---|---|---|---|---|---|---|---|---|---|---|---|---|---|---|---|---|---|---|---|---|---|---|---|
| Pro | Map | House(a) | President(b) | |||||||||||||||||||||||||||||||||||||||||||||||||||||||||||||||||||||||||||||||||||||||||||||||
| NJ-2 |  |
Jeff Van Drew | 2019 | 1st |
|
7.6% | 4.6% | |||||||||||||||||||||||||||||||||||||||||||||||||||||||||||||||||||||||||||||||||||||||||||
|
Amy Kennedy
Jeff Van Drew*
|
||||||||||||||||||||||||||||||||||||||||||||||||||||||||||||||||||||||||||||||||||||||||||||||||||
| NJ-3 |  |
Andy Kim | 2019 | 1st |
|
1.2% | 6.2% | |||||||||||||||||||||||||||||||||||||||||||||||||||||||||||||||||||||||||||||||||||||||||||
|
Andy Kim*
David Richter
|
||||||||||||||||||||||||||||||||||||||||||||||||||||||||||||||||||||||||||||||||||||||||||||||||||
| NJ-7 |  |
Tom Malinowski | 2019 | 1st |
|
5.0% | 1.1% | |||||||||||||||||||||||||||||||||||||||||||||||||||||||||||||||||||||||||||||||||||||||||||
|
Tom Malinowski*
Thomas Kean, Jr
|
||||||||||||||||||||||||||||||||||||||||||||||||||||||||||||||||||||||||||||||||||||||||||||||||||
| NJ-1 | 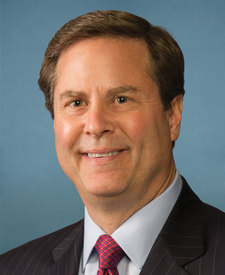 |
Donald Norcross | 2014 | 4th |
|
31.2% | 24.5% | |||||||||||||||||||||||||||||||||||||||||||||||||||||||||||||||||||||||||||||||||||||||||||
|
Donald Norcross*
Claire Gustafson
|
||||||||||||||||||||||||||||||||||||||||||||||||||||||||||||||||||||||||||||||||||||||||||||||||||
| NJ-4 |  |
Christopher Smith | 1981 | 20th |
|
12.3% | 14.8% | |||||||||||||||||||||||||||||||||||||||||||||||||||||||||||||||||||||||||||||||||||||||||||
|
Stephanie Schmid
Christopher Smith*
|
||||||||||||||||||||||||||||||||||||||||||||||||||||||||||||||||||||||||||||||||||||||||||||||||||
| NJ-5 | 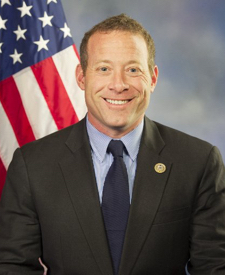 |
Josh Gottheimer | 2017 | 2nd |
|
16.9% | 1.0% | |||||||||||||||||||||||||||||||||||||||||||||||||||||||||||||||||||||||||||||||||||||||||||
|
Josh Gottheimer*
Frank Pallota
|
||||||||||||||||||||||||||||||||||||||||||||||||||||||||||||||||||||||||||||||||||||||||||||||||||
| NJ-6 |  |
Frank Pallone | 1988 | 17th |
|
27.2% | 15.6% | |||||||||||||||||||||||||||||||||||||||||||||||||||||||||||||||||||||||||||||||||||||||||||
|
Frank Pallone, Jr.*
Christian Onuoha
|
||||||||||||||||||||||||||||||||||||||||||||||||||||||||||||||||||||||||||||||||||||||||||||||||||
| NJ-8 | 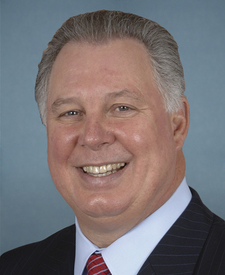 |
Albio Sires | 2006 | 8th |
|
59.6% | 54.2% | |||||||||||||||||||||||||||||||||||||||||||||||||||||||||||||||||||||||||||||||||||||||||||
|
Albio Sires*
Jason Mushnick
|
||||||||||||||||||||||||||||||||||||||||||||||||||||||||||||||||||||||||||||||||||||||||||||||||||
| NJ-9 |  |
Bill Pascrell Jr. | 1997 | 12th |
|
41.4% | 31.2% | |||||||||||||||||||||||||||||||||||||||||||||||||||||||||||||||||||||||||||||||||||||||||||
|
Bill Pascrell, Jr.*
Billy Prempeh
|
||||||||||||||||||||||||||||||||||||||||||||||||||||||||||||||||||||||||||||||||||||||||||||||||||
| NJ-10 | 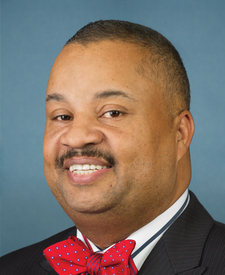 |
Donald Payne Jr. | 2012 | 5th |
|
77.6% | 72.4% | |||||||||||||||||||||||||||||||||||||||||||||||||||||||||||||||||||||||||||||||||||||||||||
|
Donald Payne, Jr.*
Jennifer Zinone
|
||||||||||||||||||||||||||||||||||||||||||||||||||||||||||||||||||||||||||||||||||||||||||||||||||
| NJ-11 | 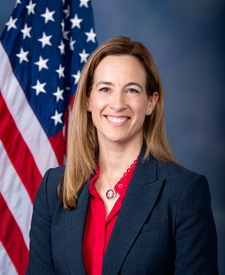 |
Mikie Sherrill | 2019 | 1st |
|
14.6% | 0.8% | |||||||||||||||||||||||||||||||||||||||||||||||||||||||||||||||||||||||||||||||||||||||||||
|
Mikie Sherrill*
Rosemary Becchi
|
||||||||||||||||||||||||||||||||||||||||||||||||||||||||||||||||||||||||||||||||||||||||||||||||||
| NJ-12 | 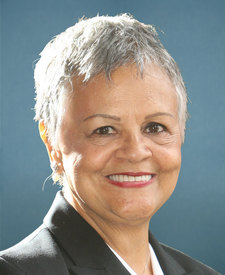 |
Bonnie Coleman | 2015 | 3rd |
|
37.3% | 33.2% | |||||||||||||||||||||||||||||||||||||||||||||||||||||||||||||||||||||||||||||||||||||||||||
|
Bonnie Watson Coleman*
Mark Razzoli
|
||||||||||||||||||||||||||||||||||||||||||||||||||||||||||||||||||||||||||||||||||||||||||||||||||
(a)Source: Daily Kos, 270toWin research. The margin is the percentage difference between the top two vote-getters in 2018.
More recent results (i.e., special elections held in 2019-20 for vacancies) are not displayed.
† Race was uncontested | ^Top two vote-getters were from the same party
(b)Source: Daily Kos. The margin is the percentage difference between Donald Trump and Hillary Clinton.

