2020 Texas House Election Interactive Map
All US House seats to be contested in 2020
Texas has 36 congressional districts, the 2nd largest delegation in the country. Democrats gained two seats in 2018, but the GOP still holds a 23-13 edge. Six of those Republicans - three in competitive districts - have announced they will not run for re-election this year.
2020 will be the final election with this map, as redistricting will occur in 2021 after the 2020 Census. Texas is expected to gain three additional congressional districts, more than any other state. These will be first contested in the 2022 election.
To create and share your own forecast, visit the 2020 House Interactive Map.

Hover over a district for details.
| District | Incumbent | Party | Since | Term | Predictions | Margin of Victory | ||||||||||||||||||||||||||||||||||||||||||||||||||||||||||||||||||||||||||||||||||||||||||||
|---|---|---|---|---|---|---|---|---|---|---|---|---|---|---|---|---|---|---|---|---|---|---|---|---|---|---|---|---|---|---|---|---|---|---|---|---|---|---|---|---|---|---|---|---|---|---|---|---|---|---|---|---|---|---|---|---|---|---|---|---|---|---|---|---|---|---|---|---|---|---|---|---|---|---|---|---|---|---|---|---|---|---|---|---|---|---|---|---|---|---|---|---|---|---|---|---|---|---|
| Pro | Map | House(a) | President(b) | |||||||||||||||||||||||||||||||||||||||||||||||||||||||||||||||||||||||||||||||||||||||||||||||
| TX-2 |  |
Daniel Crenshaw | 2019 | 1st |
|
7.2% | 9.3% | |||||||||||||||||||||||||||||||||||||||||||||||||||||||||||||||||||||||||||||||||||||||||||
|
Sima Ladjevardian
Dan Crenshaw*
|
||||||||||||||||||||||||||||||||||||||||||||||||||||||||||||||||||||||||||||||||||||||||||||||||||
| TX-3 | 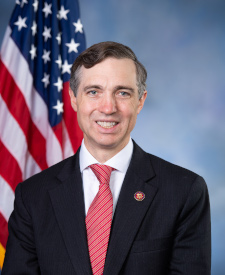 |
Van Taylor | 2019 | 1st |
|
10.0% | 14.2% | |||||||||||||||||||||||||||||||||||||||||||||||||||||||||||||||||||||||||||||||||||||||||||
|
Lulu Seikaly
Van Taylor*
|
||||||||||||||||||||||||||||||||||||||||||||||||||||||||||||||||||||||||||||||||||||||||||||||||||
| TX-6 |  |
Ron Wright | 2019 | 1st |
|
7.7% | 12.3% | |||||||||||||||||||||||||||||||||||||||||||||||||||||||||||||||||||||||||||||||||||||||||||
|
Stephen Daniel
Ron Wright*
|
||||||||||||||||||||||||||||||||||||||||||||||||||||||||||||||||||||||||||||||||||||||||||||||||||
| TX-7 | 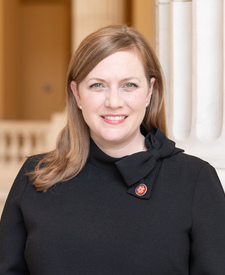 |
Lizzie Fletcher | 2019 | 1st |
|
5.0% | 1.4% | |||||||||||||||||||||||||||||||||||||||||||||||||||||||||||||||||||||||||||||||||||||||||||
|
Lizzie Pannill Fletcher*
Wesley Hunt
|
||||||||||||||||||||||||||||||||||||||||||||||||||||||||||||||||||||||||||||||||||||||||||||||||||
| TX-10 | 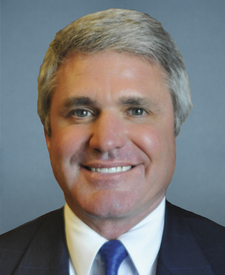 |
Michael McCaul | 2005 | 8th |
|
3.9% | 9.0% | |||||||||||||||||||||||||||||||||||||||||||||||||||||||||||||||||||||||||||||||||||||||||||
|
Mike Siegel
Michael McCaul*
|
||||||||||||||||||||||||||||||||||||||||||||||||||||||||||||||||||||||||||||||||||||||||||||||||||
| TX-21 | 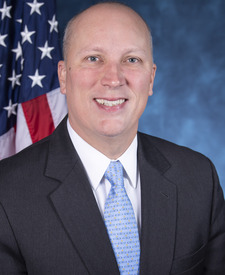 |
Chip Roy | 2019 | 1st |
|
2.8% | 10.0% | |||||||||||||||||||||||||||||||||||||||||||||||||||||||||||||||||||||||||||||||||||||||||||
|
Wendy Davis
Chip Roy*
|
||||||||||||||||||||||||||||||||||||||||||||||||||||||||||||||||||||||||||||||||||||||||||||||||||
| TX-22 | 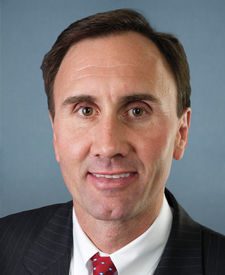 |
Pete Olson | 2009 | 6th |
|
4.9% | 7.9% | |||||||||||||||||||||||||||||||||||||||||||||||||||||||||||||||||||||||||||||||||||||||||||
|
Incumbent not running for re-election in 2020.
Sri Preston Kulkarni
Troy Nehls
|
||||||||||||||||||||||||||||||||||||||||||||||||||||||||||||||||||||||||||||||||||||||||||||||||||
| TX-23 | 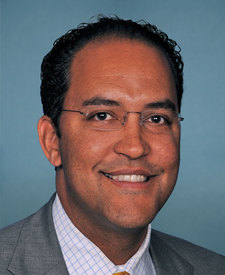 |
Will Hurd | 2015 | 3rd |
|
0.4% | 3.4% | |||||||||||||||||||||||||||||||||||||||||||||||||||||||||||||||||||||||||||||||||||||||||||
|
Incumbent not running for re-election in 2020.
Gina Jones
Tony Gonzales
|
||||||||||||||||||||||||||||||||||||||||||||||||||||||||||||||||||||||||||||||||||||||||||||||||||
| TX-24 | 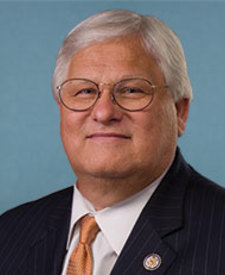 |
Kenny Marchant | 2005 | 8th |
|
3.2% | 6.2% | |||||||||||||||||||||||||||||||||||||||||||||||||||||||||||||||||||||||||||||||||||||||||||
|
Incumbent not running for re-election in 2020.
Candace Valenzuela
Beth Duyne
|
||||||||||||||||||||||||||||||||||||||||||||||||||||||||||||||||||||||||||||||||||||||||||||||||||
| TX-25 | 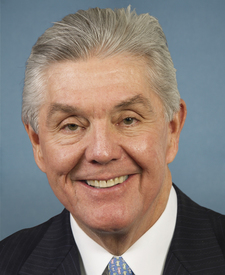 |
Roger Williams | 2013 | 4th |
|
8.9% | 14.9% | |||||||||||||||||||||||||||||||||||||||||||||||||||||||||||||||||||||||||||||||||||||||||||
|
Julie Oliver
Roger Williams*
|
||||||||||||||||||||||||||||||||||||||||||||||||||||||||||||||||||||||||||||||||||||||||||||||||||
| TX-31 |  |
John Carter | 2003 | 9th |
|
2.9% | 12.7% | |||||||||||||||||||||||||||||||||||||||||||||||||||||||||||||||||||||||||||||||||||||||||||
|
Donna Imam
John Carter*
|
||||||||||||||||||||||||||||||||||||||||||||||||||||||||||||||||||||||||||||||||||||||||||||||||||
| TX-32 |  |
Colin Allred | 2019 | 1st |
|
6.3% | 1.9% | |||||||||||||||||||||||||||||||||||||||||||||||||||||||||||||||||||||||||||||||||||||||||||
|
Colin Allred*
Genevieve Collins
|
||||||||||||||||||||||||||||||||||||||||||||||||||||||||||||||||||||||||||||||||||||||||||||||||||
| TX-1 |  |
Louie Gohmert | 2005 | 8th |
|
46.0% | 46.9% | |||||||||||||||||||||||||||||||||||||||||||||||||||||||||||||||||||||||||||||||||||||||||||
|
Hank Gilbert
Louie Gohmert*
|
||||||||||||||||||||||||||||||||||||||||||||||||||||||||||||||||||||||||||||||||||||||||||||||||||
| TX-4 |  |
OPEN |
|
52.6% | 53.6% | |||||||||||||||||||||||||||||||||||||||||||||||||||||||||||||||||||||||||||||||||||||||||||||
|
Russell Foster
Patrick Fallon
|
||||||||||||||||||||||||||||||||||||||||||||||||||||||||||||||||||||||||||||||||||||||||||||||||||
| TX-5 |  |
Lance Gooden | 2019 | 1st |
|
24.7% | 28.4% | |||||||||||||||||||||||||||||||||||||||||||||||||||||||||||||||||||||||||||||||||||||||||||
|
Carolyn Salter
Lance Gooden*
|
||||||||||||||||||||||||||||||||||||||||||||||||||||||||||||||||||||||||||||||||||||||||||||||||||
| TX-8 |  |
Kevin Brady | 1997 | 12th |
|
48.6% | 48.8% | |||||||||||||||||||||||||||||||||||||||||||||||||||||||||||||||||||||||||||||||||||||||||||
|
Elizabeth Hernandez
Kevin Brady*
|
||||||||||||||||||||||||||||||||||||||||||||||||||||||||||||||||||||||||||||||||||||||||||||||||||
| TX-9 | 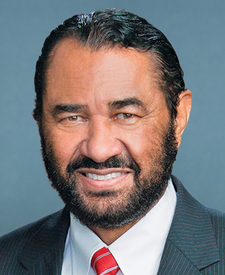 |
Al Green | 2005 | 8th |
|
89.0% | 61.3% | |||||||||||||||||||||||||||||||||||||||||||||||||||||||||||||||||||||||||||||||||||||||||||
|
Al Green*
Johnny Teague
|
||||||||||||||||||||||||||||||||||||||||||||||||||||||||||||||||||||||||||||||||||||||||||||||||||
| TX-11 | 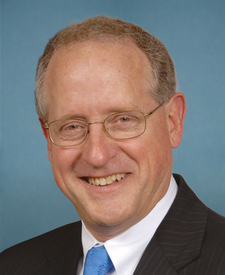 |
K. Michael Conaway | 2005 | 8th |
|
61.8% | 58.7% | |||||||||||||||||||||||||||||||||||||||||||||||||||||||||||||||||||||||||||||||||||||||||||
|
Incumbent not running for re-election in 2020.
Jon Hogg
August Pfluger
|
||||||||||||||||||||||||||||||||||||||||||||||||||||||||||||||||||||||||||||||||||||||||||||||||||
| TX-12 | 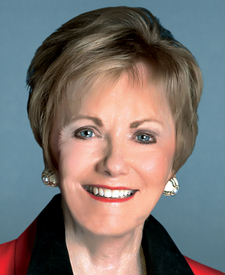 |
Kay Granger | 1997 | 12th |
|
30.4% | 30.2% | |||||||||||||||||||||||||||||||||||||||||||||||||||||||||||||||||||||||||||||||||||||||||||
|
Lisa Welch
Kay Granger*
|
||||||||||||||||||||||||||||||||||||||||||||||||||||||||||||||||||||||||||||||||||||||||||||||||||
| TX-13 |  |
Mac Thornberry | 1995 | 13th |
|
64.6% | 63.0% | |||||||||||||||||||||||||||||||||||||||||||||||||||||||||||||||||||||||||||||||||||||||||||
|
Incumbent not running for re-election in 2020.
Gus Trujillo
Ronny Jackson
|
||||||||||||||||||||||||||||||||||||||||||||||||||||||||||||||||||||||||||||||||||||||||||||||||||
| TX-14 | 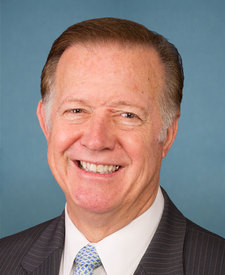 |
Randy Weber | 2013 | 4th |
|
20.1% | 19.8% | |||||||||||||||||||||||||||||||||||||||||||||||||||||||||||||||||||||||||||||||||||||||||||
|
Adrienne Bell
Randy Weber*
|
||||||||||||||||||||||||||||||||||||||||||||||||||||||||||||||||||||||||||||||||||||||||||||||||||
| TX-15 |  |
Vincente Gonzalez | 2017 | 2nd |
|
20.9% | 16.7% | |||||||||||||||||||||||||||||||||||||||||||||||||||||||||||||||||||||||||||||||||||||||||||
|
Vicente Gonzalez*
Monica De La Cruz-Hernandez
|
||||||||||||||||||||||||||||||||||||||||||||||||||||||||||||||||||||||||||||||||||||||||||||||||||
| TX-16 |  |
Veronica Escobar | 2019 | 1st |
|
41.2% | 40.7% | |||||||||||||||||||||||||||||||||||||||||||||||||||||||||||||||||||||||||||||||||||||||||||
|
Veronica Escobar*
Irene Armendariz-Jackson
|
||||||||||||||||||||||||||||||||||||||||||||||||||||||||||||||||||||||||||||||||||||||||||||||||||
| TX-17 |  |
Bill Flores | 2011 | 5th |
|
15.5% | 17.5% | |||||||||||||||||||||||||||||||||||||||||||||||||||||||||||||||||||||||||||||||||||||||||||
|
Incumbent not running for re-election in 2020.
Rick Kennedy
Pete Sessions
|
||||||||||||||||||||||||||||||||||||||||||||||||||||||||||||||||||||||||||||||||||||||||||||||||||
| TX-18 |  |
Sheila Jackson-Lee | 1995 | 13th |
|
54.4% | 56.5% | |||||||||||||||||||||||||||||||||||||||||||||||||||||||||||||||||||||||||||||||||||||||||||
|
Sheila Lee*
Wendell Champion
|
||||||||||||||||||||||||||||||||||||||||||||||||||||||||||||||||||||||||||||||||||||||||||||||||||
| TX-19 |  |
Jodey Arrington | 2017 | 2nd |
|
50.5% | 49.0% | |||||||||||||||||||||||||||||||||||||||||||||||||||||||||||||||||||||||||||||||||||||||||||
|
Tom Watson
Jodey Arrington*
|
||||||||||||||||||||||||||||||||||||||||||||||||||||||||||||||||||||||||||||||||||||||||||||||||||
| TX-20 | 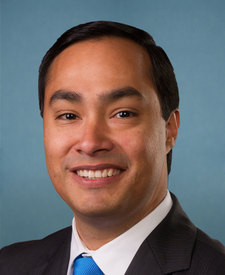 |
Joaquin Castro | 2013 | 4th |
|
80.8% | 26.7% | |||||||||||||||||||||||||||||||||||||||||||||||||||||||||||||||||||||||||||||||||||||||||||
|
Joaquin Castro*
Mauro Garza
|
||||||||||||||||||||||||||||||||||||||||||||||||||||||||||||||||||||||||||||||||||||||||||||||||||
| TX-26 | 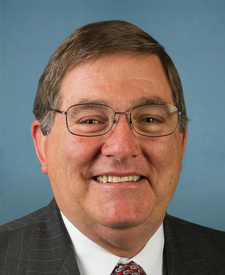 |
Michael Burgess | 2003 | 9th |
|
20.4% | 26.5% | |||||||||||||||||||||||||||||||||||||||||||||||||||||||||||||||||||||||||||||||||||||||||||
|
Carol Iannuzzi
Michael Burgess*
|
||||||||||||||||||||||||||||||||||||||||||||||||||||||||||||||||||||||||||||||||||||||||||||||||||
| TX-27 | 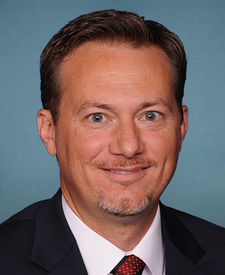 |
Michael Cloud | 2018 | 2nd |
|
23.7% | 23.6% | |||||||||||||||||||||||||||||||||||||||||||||||||||||||||||||||||||||||||||||||||||||||||||
|
Ricardo De La Fuente
Michael Cloud*
|
||||||||||||||||||||||||||||||||||||||||||||||||||||||||||||||||||||||||||||||||||||||||||||||||||
| TX-28 | 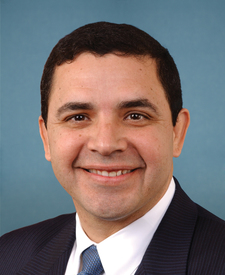 |
Henry Cuellar | 2005 | 8th |
|
84.4% | 19.8% | |||||||||||||||||||||||||||||||||||||||||||||||||||||||||||||||||||||||||||||||||||||||||||
|
Henry Cuellar*
Sandra Whitten
|
||||||||||||||||||||||||||||||||||||||||||||||||||||||||||||||||||||||||||||||||||||||||||||||||||
| TX-29 | 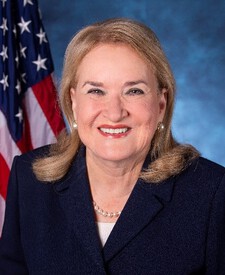 |
Sylvia Garcia | 2019 | 1st |
|
51.1% | 45.7% | |||||||||||||||||||||||||||||||||||||||||||||||||||||||||||||||||||||||||||||||||||||||||||
|
Sylvia R. Garcia*
Jaimy Zouboulikos Blanco
|
||||||||||||||||||||||||||||||||||||||||||||||||||||||||||||||||||||||||||||||||||||||||||||||||||
| TX-30 |  |
Eddie Johnson | 1993 | 14th |
|
91.0% | 60.8% | |||||||||||||||||||||||||||||||||||||||||||||||||||||||||||||||||||||||||||||||||||||||||||
|
Eddie Johnson*
Demetrick Pennie
|
||||||||||||||||||||||||||||||||||||||||||||||||||||||||||||||||||||||||||||||||||||||||||||||||||
| TX-33 | 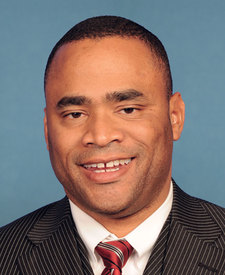 |
Marc Veasey | 2013 | 4th |
|
54.2% | 49.2% | |||||||||||||||||||||||||||||||||||||||||||||||||||||||||||||||||||||||||||||||||||||||||||
|
Marc Veasey*
Fabian Vasquez
|
||||||||||||||||||||||||||||||||||||||||||||||||||||||||||||||||||||||||||||||||||||||||||||||||||
| TX-34 | 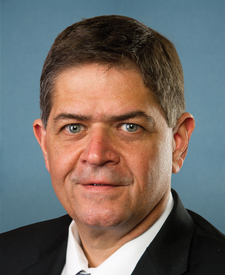 |
Filemon Vela | 2013 | 4th |
|
19.9% | 21.5% | |||||||||||||||||||||||||||||||||||||||||||||||||||||||||||||||||||||||||||||||||||||||||||
|
Filemon Vela*
Rey Gonzalez
|
||||||||||||||||||||||||||||||||||||||||||||||||||||||||||||||||||||||||||||||||||||||||||||||||||
| TX-35 | 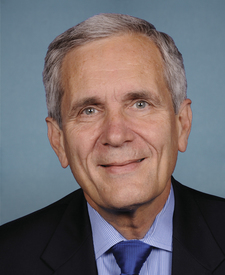 |
Lloyd Doggett | 1995 | 13th |
|
45.1% | 33.6% | |||||||||||||||||||||||||||||||||||||||||||||||||||||||||||||||||||||||||||||||||||||||||||
|
Lloyd Doggett*
Jenny Sharon
|
||||||||||||||||||||||||||||||||||||||||||||||||||||||||||||||||||||||||||||||||||||||||||||||||||
| TX-36 |  |
Brian Babin | 2015 | 3rd |
|
45.1% | 46.8% | |||||||||||||||||||||||||||||||||||||||||||||||||||||||||||||||||||||||||||||||||||||||||||
|
Rashad Lewis
Brian Babin*
|
||||||||||||||||||||||||||||||||||||||||||||||||||||||||||||||||||||||||||||||||||||||||||||||||||
(a)Source: Daily Kos, 270toWin research. The margin is the percentage difference between the top two vote-getters in 2018.
More recent results (i.e., special elections held in 2019-20 for vacancies) are not displayed.
† Race was uncontested | ^Top two vote-getters were from the same party
(b)Source: Daily Kos. The margin is the percentage difference between Donald Trump and Hillary Clinton.

