2020 Washington House Election Interactive Map
All US House seats to be contested in 2020
Washington has 10 congressional districts. Democrats increased their margin to 7-3 after flipping the 8th district in 2018.
Redistricting will occur in 2021 after the 2020 Census. While Washington is expected to maintain its 10 congressional districts, expect some changes to the district boundaries that will be effective with the 2022 election.
To create and share your own forecast, visit the 2020 House Interactive Map.

Hover over a district for details.
| District | Incumbent | Party | Since | Term | Predictions | Margin of Victory | ||||||||||||||||||||||||||||||||||||||||||||||||||||||||||||||||||||||||||||||||||||||||||||
|---|---|---|---|---|---|---|---|---|---|---|---|---|---|---|---|---|---|---|---|---|---|---|---|---|---|---|---|---|---|---|---|---|---|---|---|---|---|---|---|---|---|---|---|---|---|---|---|---|---|---|---|---|---|---|---|---|---|---|---|---|---|---|---|---|---|---|---|---|---|---|---|---|---|---|---|---|---|---|---|---|---|---|---|---|---|---|---|---|---|---|---|---|---|---|---|---|---|---|
| Pro | Map | House(a) | President(b) | |||||||||||||||||||||||||||||||||||||||||||||||||||||||||||||||||||||||||||||||||||||||||||||||
| WA-3 |  |
Jaime Herrera Beutler | 2011 | 5th |
|
5.3% | 7.4% | |||||||||||||||||||||||||||||||||||||||||||||||||||||||||||||||||||||||||||||||||||||||||||
|
Carolyn Long
Jaime Herrera Beutler*
|
||||||||||||||||||||||||||||||||||||||||||||||||||||||||||||||||||||||||||||||||||||||||||||||||||
| WA-8 | 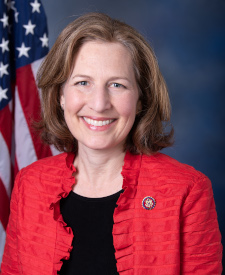 |
Kim Schrier | 2019 | 1st |
|
4.8% | 3.0% | |||||||||||||||||||||||||||||||||||||||||||||||||||||||||||||||||||||||||||||||||||||||||||
|
Kim Schrier*
Jesse Jensen
|
||||||||||||||||||||||||||||||||||||||||||||||||||||||||||||||||||||||||||||||||||||||||||||||||||
| WA-1 | 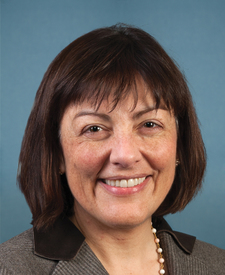 |
Suzan DelBene | 2012 | 5th |
|
18.5% | 16.3% | |||||||||||||||||||||||||||||||||||||||||||||||||||||||||||||||||||||||||||||||||||||||||||
|
Suzan DelBene*
Jeffrey Beeler
|
||||||||||||||||||||||||||||||||||||||||||||||||||||||||||||||||||||||||||||||||||||||||||||||||||
| WA-2 |  |
Rick Larsen | 2001 | 10th |
|
71.2% | 22.1% | |||||||||||||||||||||||||||||||||||||||||||||||||||||||||||||||||||||||||||||||||||||||||||
|
Rick Larsen*
Timothy Hazelo
|
||||||||||||||||||||||||||||||||||||||||||||||||||||||||||||||||||||||||||||||||||||||||||||||||||
| WA-4 | 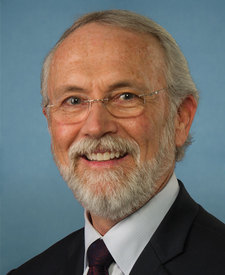 |
Dan Newhouse | 2015 | 3rd |
|
25.6% | 22.8% | |||||||||||||||||||||||||||||||||||||||||||||||||||||||||||||||||||||||||||||||||||||||||||
|
Douglas McKinley
Dan Newhouse*
|
||||||||||||||||||||||||||||||||||||||||||||||||||||||||||||||||||||||||||||||||||||||||||||||||||
| WA-5 |  |
Cathy McMorris Rodgers | 2005 | 8th |
|
9.5% | 13.1% | |||||||||||||||||||||||||||||||||||||||||||||||||||||||||||||||||||||||||||||||||||||||||||
|
Dave Wilson
Cathy McMorris Rodgers*
|
||||||||||||||||||||||||||||||||||||||||||||||||||||||||||||||||||||||||||||||||||||||||||||||||||
| WA-6 |  |
Derek Kilmer | 2013 | 4th |
|
27.7% | 12.3% | |||||||||||||||||||||||||||||||||||||||||||||||||||||||||||||||||||||||||||||||||||||||||||
|
Derek Kilmer*
Elizabeth Kreiselmaier
|
||||||||||||||||||||||||||||||||||||||||||||||||||||||||||||||||||||||||||||||||||||||||||||||||||
| WA-7 |  |
Pramila Jayapal | 2017 | 2nd |
|
67.1% | 69.9% | |||||||||||||||||||||||||||||||||||||||||||||||||||||||||||||||||||||||||||||||||||||||||||
|
Pramila Jayapal*
Craig Keller
|
||||||||||||||||||||||||||||||||||||||||||||||||||||||||||||||||||||||||||||||||||||||||||||||||||
| WA-9 | 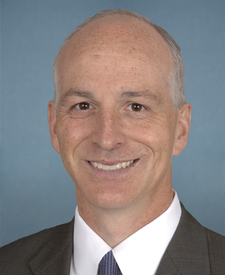 |
Adam Smith | 1997 | 12th |
|
36.2% ^ | 47.2% | |||||||||||||||||||||||||||||||||||||||||||||||||||||||||||||||||||||||||||||||||||||||||||
|
Adam Smith*
Doug Basler
|
||||||||||||||||||||||||||||||||||||||||||||||||||||||||||||||||||||||||||||||||||||||||||||||||||
| WA-10 | 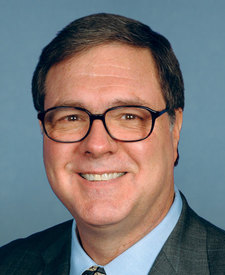 |
Denny Heck | 2013 | 4th |
|
23.0% | 11.4% | |||||||||||||||||||||||||||||||||||||||||||||||||||||||||||||||||||||||||||||||||||||||||||
|
Incumbent not running for re-election in 2020.
Beth Doglio
Marilyn Strickland
|
||||||||||||||||||||||||||||||||||||||||||||||||||||||||||||||||||||||||||||||||||||||||||||||||||
(a)Source: Daily Kos, 270toWin research. The margin is the percentage difference between the top two vote-getters in 2018.
More recent results (i.e., special elections held in 2019-20 for vacancies) are not displayed.
† Race was uncontested | ^Top two vote-getters were from the same party
(b)Source: Daily Kos. The margin is the percentage difference between Donald Trump and Hillary Clinton.

