2022 Tennessee House Election Interactive Map
All US House seats to be contested in 2022
Redistricting: No change in the number of districts. Toggle between 'Consensus Forecast' and 'Current House' to see how the map has changed.
Tennessee has nine congressional districts, seven are held by Republicans. That is likely to increase by one after redistricting 'cracked' Nashville into three districts, making District 5 much more Republican. The long-time Democratic representative there, Jim Cooper announced his retirement.
To create and share your own forecast, visit the 2022 House Interactive Map.

Hover over a district for details.
| District | Incumbent | Party | Since | Term | Predictions | Margin of Victory | ||||||||||||||||||||||||||||||||||||||||||||||||||||||||||||||||||||||||||||||||||||||||||||
|---|---|---|---|---|---|---|---|---|---|---|---|---|---|---|---|---|---|---|---|---|---|---|---|---|---|---|---|---|---|---|---|---|---|---|---|---|---|---|---|---|---|---|---|---|---|---|---|---|---|---|---|---|---|---|---|---|---|---|---|---|---|---|---|---|---|---|---|---|---|---|---|---|---|---|---|---|---|---|---|---|---|---|---|---|---|---|---|---|---|---|---|---|---|---|---|---|---|---|
| Consensus | House(a) | President(c) | ||||||||||||||||||||||||||||||||||||||||||||||||||||||||||||||||||||||||||||||||||||||||||||||||
| TN-1 |  |
Diana Harshbarger | 2021 | 1st | 52.2% | 54.1% | ||||||||||||||||||||||||||||||||||||||||||||||||||||||||||||||||||||||||||||||||||||||||||||
| TN-2 | 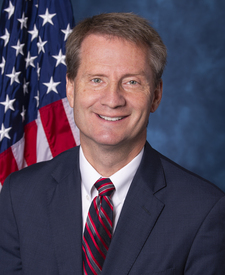 |
Tim Burchett | 2019 | 2nd | 36.5% | 29.1% | ||||||||||||||||||||||||||||||||||||||||||||||||||||||||||||||||||||||||||||||||||||||||||||
| TN-3 | 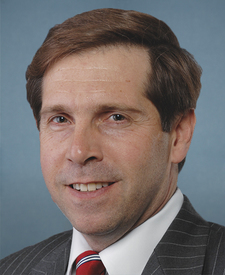 |
Chuck Fleischmann | 2011 | 6th | 36.8% | 32.4% | ||||||||||||||||||||||||||||||||||||||||||||||||||||||||||||||||||||||||||||||||||||||||||||
| TN-4 | 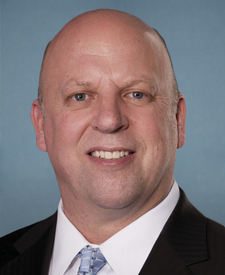 |
Scott DesJarlais | 2011 | 6th | 33.3% | 36.8% | ||||||||||||||||||||||||||||||||||||||||||||||||||||||||||||||||||||||||||||||||||||||||||||
| TN-5 | 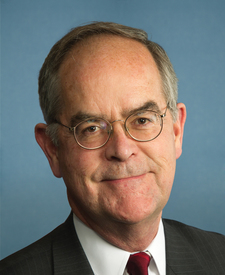 |
Jim Cooper | 2003 | 10th | * | 23.6% | ||||||||||||||||||||||||||||||||||||||||||||||||||||||||||||||||||||||||||||||||||||||||||||
|
Incumbent not running for re-election in 2022.
|
||||||||||||||||||||||||||||||||||||||||||||||||||||||||||||||||||||||||||||||||||||||||||||||||||
| TN-6 | 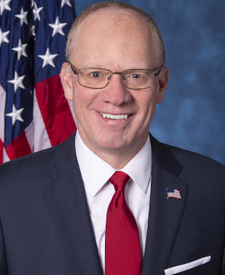 |
John Rose | 2019 | 2nd | 49.6% | 47.1% | ||||||||||||||||||||||||||||||||||||||||||||||||||||||||||||||||||||||||||||||||||||||||||||
| TN-7 |  |
Mark Green | 2019 | 2nd | 42.5% | 35.6% | ||||||||||||||||||||||||||||||||||||||||||||||||||||||||||||||||||||||||||||||||||||||||||||
| TN-8 |  |
David Kustoff | 2017 | 3rd | 38.9% | 32.2% | ||||||||||||||||||||||||||||||||||||||||||||||||||||||||||||||||||||||||||||||||||||||||||||
| TN-9 | 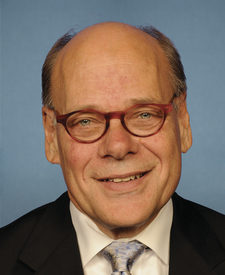 |
Steve Cohen | 2007 | 8th | 57.2% | 58.6% | ||||||||||||||||||||||||||||||||||||||||||||||||||||||||||||||||||||||||||||||||||||||||||||
| District | Incumbent | Party | Since | Term | Predictions | Margin of Victory | ||||||||||||||||||||||||||||||||||||||||||||||||||||||||||||||||||||||||||||||||||||||||||||
| Consensus | House(a) | President(b) | ||||||||||||||||||||||||||||||||||||||||||||||||||||||||||||||||||||||||||||||||||||||||||||||||
| TN-5 |  |
Jim Cooper | 2003 | 10th | N/A | 11.8% | ||||||||||||||||||||||||||||||||||||||||||||||||||||||||||||||||||||||||||||||||||||||||||||
|
Incumbent not running for re-election in 2022.
Heidi Campbell
Andy Ogles
|
||||||||||||||||||||||||||||||||||||||||||||||||||||||||||||||||||||||||||||||||||||||||||||||||||
| TN-1 |  |
Diana Harshbarger | 2021 | 1st | N/A | 55.2% | ||||||||||||||||||||||||||||||||||||||||||||||||||||||||||||||||||||||||||||||||||||||||||||
|
Cameron Parsons
Diana Harshbarger*
|
||||||||||||||||||||||||||||||||||||||||||||||||||||||||||||||||||||||||||||||||||||||||||||||||||
| TN-2 |  |
Tim Burchett | 2019 | 2nd | N/A | 29.8% | ||||||||||||||||||||||||||||||||||||||||||||||||||||||||||||||||||||||||||||||||||||||||||||
|
Mark Harmon
Tim Burchett*
|
||||||||||||||||||||||||||||||||||||||||||||||||||||||||||||||||||||||||||||||||||||||||||||||||||
| TN-3 |  |
Chuck Fleischmann | 2011 | 6th | N/A | 32.5% | ||||||||||||||||||||||||||||||||||||||||||||||||||||||||||||||||||||||||||||||||||||||||||||
|
Meg Gorman
Chuck Fleischmann*
|
||||||||||||||||||||||||||||||||||||||||||||||||||||||||||||||||||||||||||||||||||||||||||||||||||
| TN-4 |  |
Scott DesJarlais | 2011 | 6th | N/A | 38.4% | ||||||||||||||||||||||||||||||||||||||||||||||||||||||||||||||||||||||||||||||||||||||||||||
|
Wayne Steele
Scott DesJarlais*
|
||||||||||||||||||||||||||||||||||||||||||||||||||||||||||||||||||||||||||||||||||||||||||||||||||
| TN-6 |  |
John Rose | 2019 | 2nd | N/A | 29.4% | ||||||||||||||||||||||||||||||||||||||||||||||||||||||||||||||||||||||||||||||||||||||||||||
|
Randal Cooper
John Rose*
|
||||||||||||||||||||||||||||||||||||||||||||||||||||||||||||||||||||||||||||||||||||||||||||||||||
| TN-7 |  |
Mark Green | 2019 | 2nd | N/A | 15.3% | ||||||||||||||||||||||||||||||||||||||||||||||||||||||||||||||||||||||||||||||||||||||||||||
|
Odessa Kelly
Mark Green*
|
||||||||||||||||||||||||||||||||||||||||||||||||||||||||||||||||||||||||||||||||||||||||||||||||||
| TN-8 |  |
David Kustoff | 2017 | 3rd | N/A | 37.6% | ||||||||||||||||||||||||||||||||||||||||||||||||||||||||||||||||||||||||||||||||||||||||||||
|
Lynnette Williams
David Kustoff*
|
||||||||||||||||||||||||||||||||||||||||||||||||||||||||||||||||||||||||||||||||||||||||||||||||||
| TN-9 |  |
Steve Cohen | 2007 | 8th | N/A | 49.1% | ||||||||||||||||||||||||||||||||||||||||||||||||||||||||||||||||||||||||||||||||||||||||||||
|
Steve Cohen*
Charlotte Bergmann
|
||||||||||||||||||||||||||||||||||||||||||||||||||||||||||||||||||||||||||||||||||||||||||||||||||
(a)Source: Cook Political Report, 270toWin research. N/A for new district boundaries. In most cases, the margin is the difference between the Democratic and Republican nominee in the November 3, 2020 general election.
* Uncontested | + No major party opposition | ^ Both nominees from same party | x All-party primary
More details on the above exception types >>
President Margin is the percentage difference between Joe Biden and Donald Trump in 2020:
(b) Source: Daily Kos (when available) or Politico; based on 2022 House district boundaries
(c) Source: Daily Kos; based on House district boundaries used in 2020

