2022 Utah House Election Interactive Map
All US House seats to be contested in 2022
Redistricting: No change in the number of districts. Toggle between 'Consensus Forecast' and 'Current House' to see how the map has changed.
Utah has four congressional districts, all held by Republicans after the party won back District 4 in the 2020 election. That Salt Lake City area District 4 was 'cracked' in redistricting, turning a fairly competitive seat into one that is now safely Republican.
To create and share your own forecast, visit the 2022 House Interactive Map.

Hover over a district for details.
| District | Incumbent | Party | Since | Term | Predictions | Margin of Victory | ||||||||||||||||||||||||||||||||||||||||||||||||||||||||||||||||||||||||||||||||||||||||||||
|---|---|---|---|---|---|---|---|---|---|---|---|---|---|---|---|---|---|---|---|---|---|---|---|---|---|---|---|---|---|---|---|---|---|---|---|---|---|---|---|---|---|---|---|---|---|---|---|---|---|---|---|---|---|---|---|---|---|---|---|---|---|---|---|---|---|---|---|---|---|---|---|---|---|---|---|---|---|---|---|---|---|---|---|---|---|---|---|---|---|---|---|---|---|---|---|---|---|---|
| Consensus | House(a) | President(c) | ||||||||||||||||||||||||||||||||||||||||||||||||||||||||||||||||||||||||||||||||||||||||||||||||
| UT-1 |  |
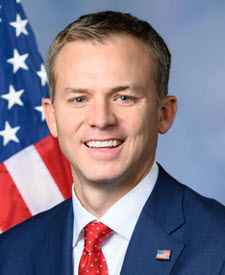
Blake Moore | 2021 | 1st | 39.0% | 32.6% | ||||||||||||||||||||||||||||||||||||||||||||||||||||||||||||||||||||||||||||||||||||||||||||
| UT-2 |  |
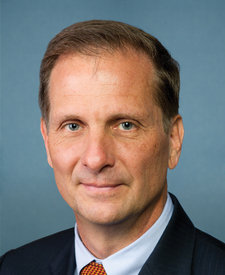
Chris Stewart | 2013 | 5th | 22.3% | 15.9% | ||||||||||||||||||||||||||||||||||||||||||||||||||||||||||||||||||||||||||||||||||||||||||||
| UT-3 |  |
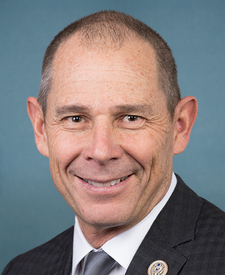
John Curtis | 2017 | 3rd | 41.9% | 25.1% | ||||||||||||||||||||||||||||||||||||||||||||||||||||||||||||||||||||||||||||||||||||||||||||
| UT-4 |  |
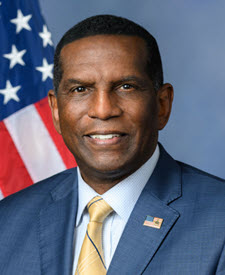
Burgess Owens | 2021 | 1st | 0.9% | 9.1% | ||||||||||||||||||||||||||||||||||||||||||||||||||||||||||||||||||||||||||||||||||||||||||||
| District | Incumbent | Party | Since | Term | Predictions | Margin of Victory | ||||||||||||||||||||||||||||||||||||||||||||||||||||||||||||||||||||||||||||||||||||||||||||
| Consensus | House(a) | President(b) | ||||||||||||||||||||||||||||||||||||||||||||||||||||||||||||||||||||||||||||||||||||||||||||||||
| UT-1 |  |
Blake Moore | 2021 | 1st | N/A | 20.5% | ||||||||||||||||||||||||||||||||||||||||||||||||||||||||||||||||||||||||||||||||||||||||||||
|
Rick Jones
Blake Moore*
|
||||||||||||||||||||||||||||||||||||||||||||||||||||||||||||||||||||||||||||||||||||||||||||||||||
| UT-2 |  |
Chris Stewart | 2013 | 5th | N/A | 17.8% | ||||||||||||||||||||||||||||||||||||||||||||||||||||||||||||||||||||||||||||||||||||||||||||
|
Nick Mitchell
Chris Stewart*
|
||||||||||||||||||||||||||||||||||||||||||||||||||||||||||||||||||||||||||||||||||||||||||||||||||
| UT-3 |  |
John Curtis | 2017 | 3rd | N/A | 20.4% | ||||||||||||||||||||||||||||||||||||||||||||||||||||||||||||||||||||||||||||||||||||||||||||
|
Glenn Wright
John Curtis*
|
||||||||||||||||||||||||||||||||||||||||||||||||||||||||||||||||||||||||||||||||||||||||||||||||||
| UT-4 |  |
Burgess Owens | 2021 | 1st | N/A | 27.1% | ||||||||||||||||||||||||||||||||||||||||||||||||||||||||||||||||||||||||||||||||||||||||||||
|
Darlene McDonald
Burgess Owens*
|
||||||||||||||||||||||||||||||||||||||||||||||||||||||||||||||||||||||||||||||||||||||||||||||||||
(a)Source: Cook Political Report, 270toWin research. N/A for new district boundaries. In most cases, the margin is the difference between the Democratic and Republican nominee in the November 3, 2020 general election.
* Uncontested | + No major party opposition | ^ Both nominees from same party | x All-party primary
More details on the above exception types >>
President Margin is the percentage difference between Joe Biden and Donald Trump in 2020:
(b) Source: Daily Kos (when available) or Politico; based on 2022 House district boundaries
(c) Source: Daily Kos; based on House district boundaries used in 2020

