Electoral Map Based on Washington Post 50-State Poll
By 270toWin Staff
September 6, 2016
The Washington Post, in conjunction with SurveyMonkey, has conducted a poll* in each of the 50 states. Per the Post, "Donald Trump is within striking distance in the Upper Midwest, but Hillary Clinton’s strength in many battlegrounds and some traditional Republican strongholds gives her a big electoral college advantage".
Here's how the state-by-state results look on an electoral map, using the same approach as the regular electoral map based on polls:
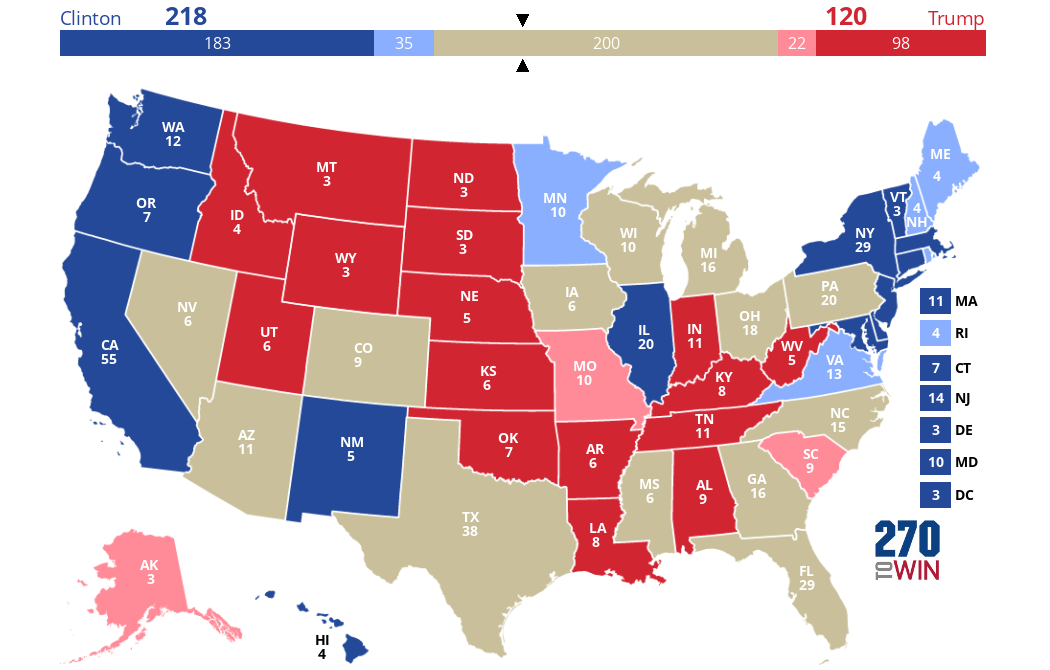
For purposes of the map, states with margins of 5 points or less are considered toss-ups, while those with margins greater than 10 points are considered 'safe'. The lighter red/blue are 'lean' states, in-between those two ranges.
In the electoral map based on polls, Clinton currently leads 262-145 with 131 electoral votes as toss-up. 84 of Clinton's electoral votes, and 42 of Trump's are in the 'lean' area. Most of the larger 'lean' states end up as toss-up in the Washington Post-SurveyMonkey poll. Of particular note is Texas, where Clinton led by one. On the other hand, Pennsylvania and Michigan, which together comprise about as many electoral votes as Texas, were much closer in this poll than in the polling average; these states have been leaning toward Clinton. Other significant differences vs. traditional polls include Colorado and Mississippi (much closer) and Missouri (larger Trump lead).
The above analysis is all based on Clinton vs. Trump head-to-head. The poll also looked at a four-way race in each state. Both Gary Johnson and Jill Stein greatly outperformed traditional polling, with Johnson at 10% or higher in more than 40 states, including 25% in New Mexico (just 4% less than Trump). If this set of surveys is correct, the third party nominees have significant support not registering in traditional polling. This would be a very significant finding, although we have no way of knowing which view of the world is correct at this point.
* SurveyMonkey conducts polls using online-based sampling. These are surveys taken from a pool of recruited respondents, a subset of the population that takes surveys on the SurveyMonkey platform. This differs from traditional polling where respondents are selected at random, meaning (in theory) that any member of the population being sampled (e.g., likely voters) could be selected. In traditional polling, a margin of error, to reflect how far the sample population might deviate from the full population (based on probability theory) is calculated. In the SurveyMonkey polls, only those who have opted-in to the platform can be selected, thus no margin of error associatd with the full population can be calculated. However, in these "non-probability samples, testing is necessary to ensure a particular sampling strategy, along with adjustments to match population demographics, can consistently produce accurate estimates."

