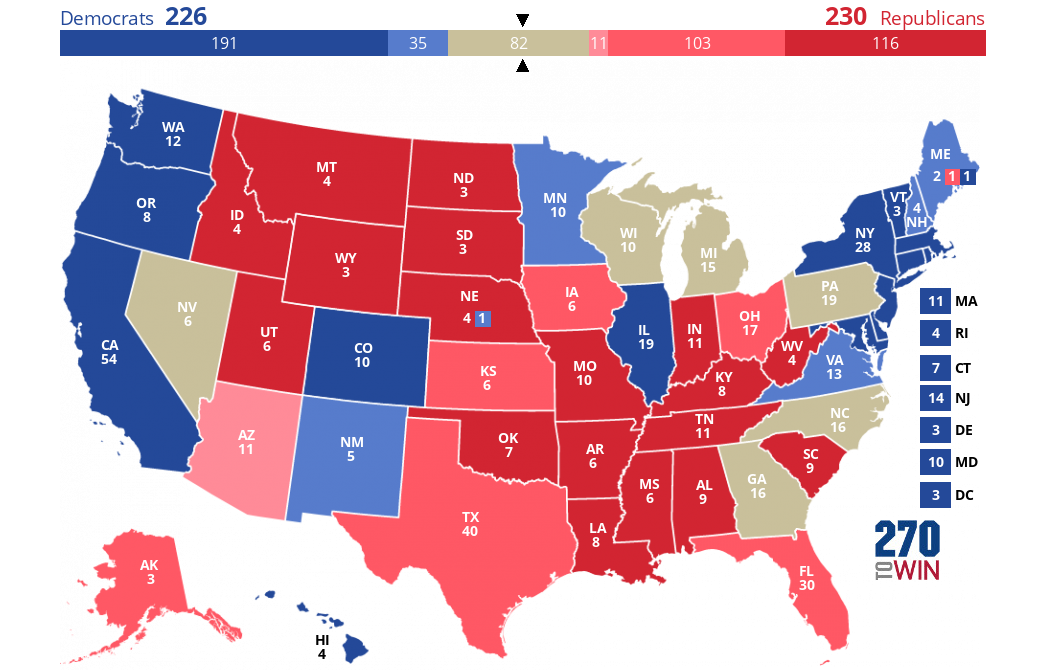
1992 Presidential Election Interactive Map
270 electoral votes to win
Change history with the 1992 presidential election interactive map.
Update a state winner by clicking it to rotate through candidates. Alternately, select a candidate color in the Map Color Palette, then select states to apply. Use the edit button in the Palette to update candidate information.
Split electoral vote states - if any - are not interactive. Use the table below the map to make changes.
For full details, see the user guide.

VT |
|
NH |
|
MA |
|
RI |
|
CT |
|
NJ |
|
DE |
|
MD |
|
DC |

Clinton |
Bush |
Perot |
Undecided |
||
Edit Candidates
| Active | Candidate Name | Party | Color |
|---|---|---|---|
|
|
|||
|
|
|||
|
|
|||
|
|
|||
|
|
Please enter a name, party, and color for each candidate.
Split Electoral Votes
States shown here did not allocate all their available electoral votes to one candidate. The historical split can be edited in this table. You can also use the drop down menu to split other states.
Removing the split () will set the state to undecided and make it interactive on the map.
1992 Actual Election Results
| Candidate | Party | Electoral Votes | Popular Votes | ||
|---|---|---|---|---|---|
| ✓ | William J. Clinton | Democratic | 370 | 44,909,889 | |
| George Bush (I) | Republican | 168 | 39,104,545 | ||
| Ross Perot | Independent | 0 | 19,742,267 |
1992 Election Facts
- California electoral votes now >10% of total; greatest concentration since New York in 1868
- Independent candidate H. Ross Perot received 19,741,065 votes, most ever for a 3rd party candidate, but no Electoral Votes
- Popular vote totals from Federal Elections 92.
- Issues of the Day: Persian Gulf War, Fall of Berlin Wall and Breakup of Soviet Union, Recession
- Nebraska shifts from winner-take-all to congressional district method for allocating electoral votes
