Interactive Electoral and Senate Maps Based on Polling
By 270toWin Staff
June 18, 2020
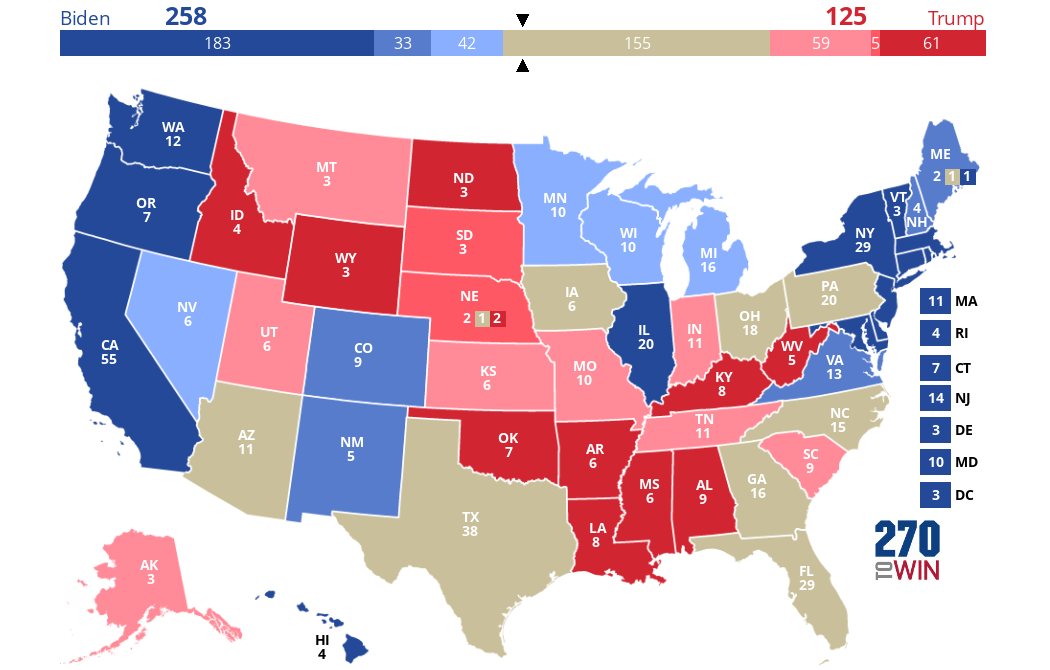
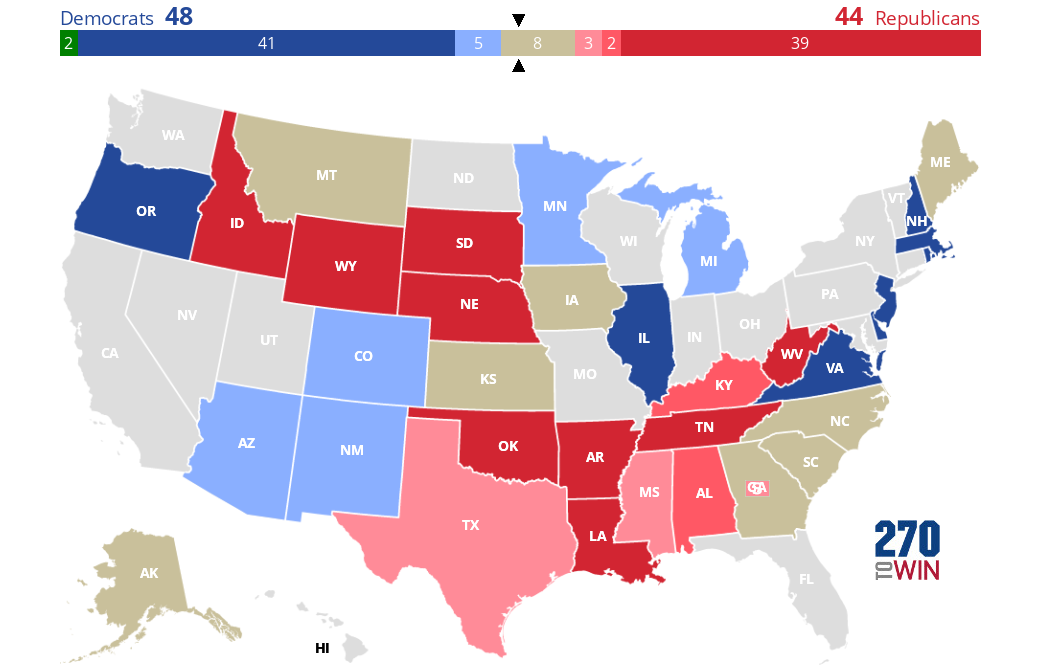
These maps will track the state of the race based purely on available polling. Where there are no polls, the consensus rating is used. The maps are automatically updated three times each day.
The final daily update is added to the timeline, which appears above the map. This will let you see how the map evolves over time.
States where the margin is <5% are shown as toss-up. Leaning is <10%, likely <15%. Safe is 15% or higher.
The polling maps will shift more frequently than and may vary significantly from the consensus maps, although those differences should narrow as the election draws closer. The discrepancy has to do with the fact that polling is a snapshot in time - and we are still about 140 days out from Election Day. There is also limited polling in some states, which may or may not reflect the current state of the race.
Related: Direct links to polling by state
The images below are embedded, and will update as the map changes. Click or tap for the interactive version and timeline.
Electoral Polling Map
The consensus map as well as a number of other forecasts can be found here.
Senate Polling Map
Use particular caution with this map, as Senate polling is extremely limited in most states. Also, this map is new as of June 18; we will add the timeline once we have a few days of history.
The consensus map as well as a number of other forecasts can be found here.


