Princeton Election Consortium
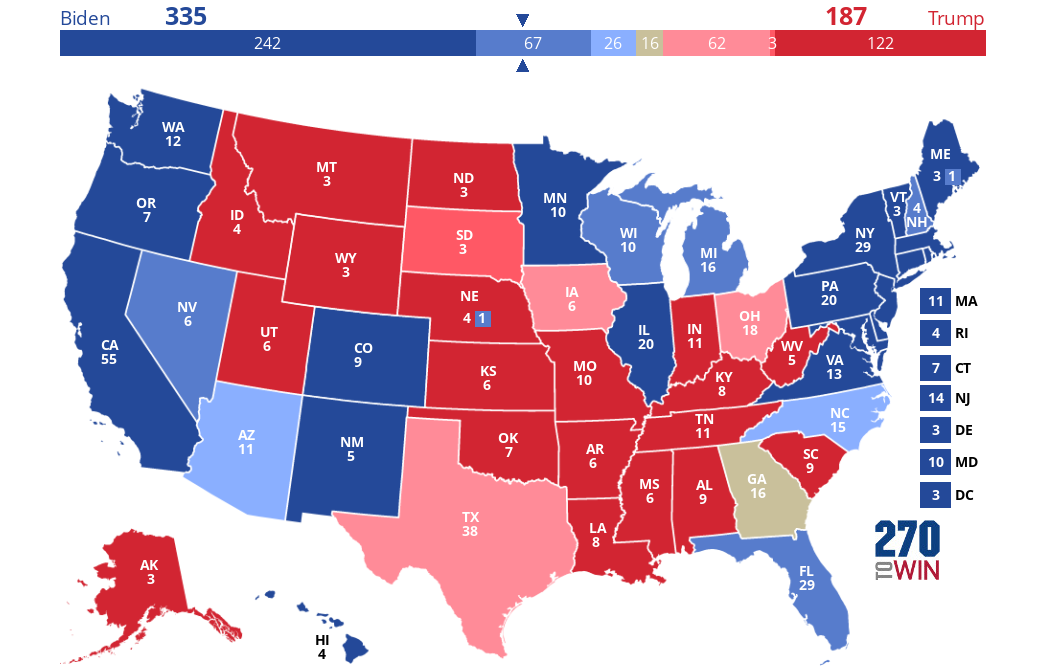
Map Based on Polling
Part of the Princeton Election Consortium polling-derived forecast series for the likelihood of a Biden or Trump victory in each state.
You can view the full series of three maps here.
A state is shown as toss-up where the probability is 60% or less. The colored gradients get progressively deeper as the probability increases: Leans (<80%), Likely (<95%), Safe (95%+).
Use this map as a starting point to create and share your own 2020 presidential election forecast.
You are viewing:
VT |
|
NH |
|
MA |
|
RI |
|
CT |
|
NJ |
|
DE |
|
MD |
|
DC |

Map Updated: Nov. 2, 2020 at 06:30 UTC (1:30 AM EST)
Headlines
Rep. Andy Barr Running to Succeed Sen. Mitch McConnell
Live Results: April 22 Connecticut and Mississippi State House Special Elections
Three vacancies will be filled across these two states
Michigan Rep. Haley Stevens Running for U.S. Senate
She will look to succeed retiring fellow Democratic Sen. Gary Peters
Live Results: April 15 State Legislative and Oakland Mayoral Special Elections
Oakland voter will select a new mayor after the prior one was recalled in November
Iowa Gov. Kim Reynolds Not Seeking Reelection in 2026
In her announcement video, Reynolds cited a desire to spend more time with her family

Customize your map by changing one or more states. Return here to share it. Share or Embed your Map: Select 'Share Map' button above. Share or Embed your Map: