Massachusetts
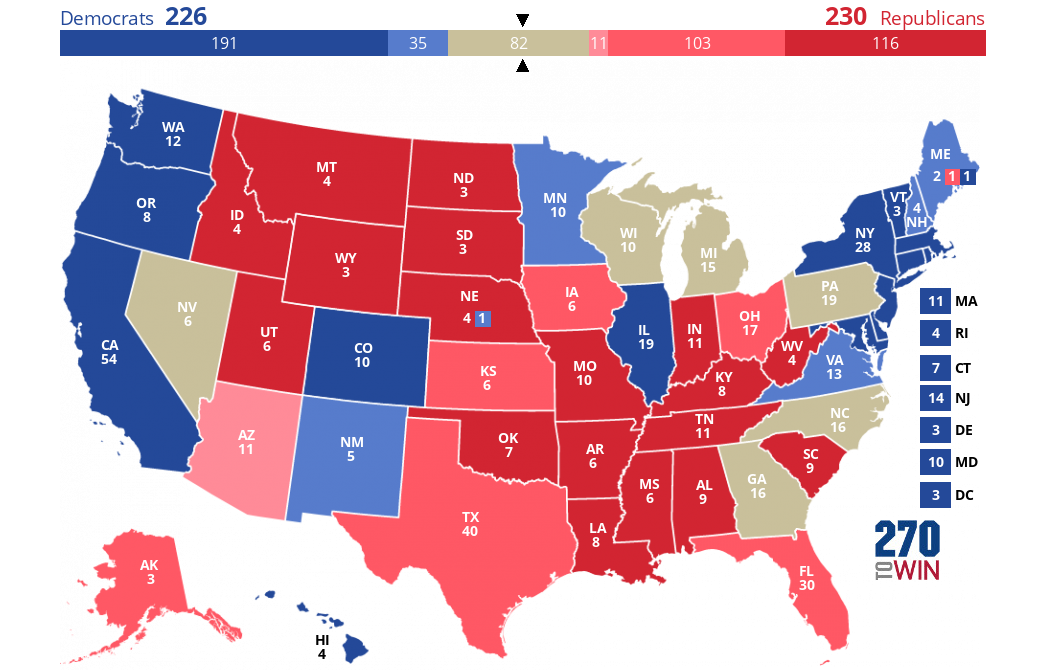
Massachusetts, one of the original 13 colonies, joined the Union in February 1788, and has participated in all 59 presidential elections. The state has been reliably Democratic since 1928, but has voted Republican four times since then – twice each for Dwight Eisenhower and Ronald Reagan. Massachusetts was the only state to vote for George McGovern in his landslide 1972 electoral loss to Richard Nixon. Like many northeastern states, Massachusetts slowly lost its electoral clout over the course of the 20th century. The state has lost 1/3 of its electoral votes since the 1920s, falling from 18 to 11. In 2020, Joe Biden beat Donald Trump 66% to 32%.
ELECTORAL VOTES
112024 ELECTION
2024 Massachusetts Polls
Recent Presidential Elections
| 2020 |
|
|||
| 2016 |
|
|||
| 2012 |
|
|||
| 2008 |
|
|||
| 2004 |
|
|||
| 2000 |
|
Presidential Voting History
State voted with the overall winning candidate
Electoral College Votes
Colored bars represent electoral votes by party. Tap or hover to see names.
U.S. Senate Voting History
| Class | 1988 | 1990 | 1992 | 1994 | 1996 | 1998 | 2000 | 2002 | 2004 | 2006 | 2008 | 2010 | 2012 | 2014 | 2016 | 2018 | 2020 | 2022 | 2024 |
|---|---|---|---|---|---|---|---|---|---|---|---|---|---|---|---|---|---|---|---|
| 1 |
D
|
D
|
D
|
D
|
D
|
D
|
D
|
||||||||||||
| 2 |
D
|
D
|
D
|
D
|
D
|
D
|
|||||||||||||
| 3 |
Data: MIT Election Data and Science Lab / Harvard Dataverse through 2018; 270toWin research. These are general election results for the years listed. Special elections, if any, are excluded.
There are three classes of Senators; one is up for election every second year. Each state has one Senator in two of the three classes.
U.S. House Voting History
| District | 1988 | 1990 | 1992 | 1994 | 1996 | 1998 | 2000 | 2002 | 2004 | 2006 | 2008 | 2010 | 2012 | 2014 | 2016 | 2018 | 2020 | 2022 | 2024 |
|---|---|---|---|---|---|---|---|---|---|---|---|---|---|---|---|---|---|---|---|
| 1 |
R
|
R
|
D
|
D
|
D
|
D
|
D
|
D
|
D
|
D
|
D
|
D
|
D
|
D
|
D
|
D
|
D
|
D
|
D
|
| 2 |
D
|
D
|
D
|
D
|
D
|
D
|
D
|
D
|
D
|
D
|
D
|
D
|
D
|
D
|
D
|
D
|
D
|
D
|
D
|
| 3 |
D
|
D
|
R
|
R
|
D
|
D
|
D
|
D
|
D
|
D
|
D
|
D
|
D
|
D
|
D
|
D
|
D
|
D
|
D
|
| 4 |
D
|
D
|
D
|
D
|
D
|
D
|
D
|
D
|
D
|
D
|
D
|
D
|
D
|
D
|
D
|
D
|
D
|
D
|
D
|
| 5 |
D
|
D
|
D
|
D
|
D
|
D
|
D
|
D
|
D
|
D
|
D
|
D
|
D
|
D
|
D
|
D
|
D
|
D
|
D
|
| 6 |
D
|
D
|
R
|
R
|
D
|
D
|
D
|
D
|
D
|
D
|
D
|
D
|
D
|
D
|
D
|
D
|
D
|
D
|
D
|
| 7 |
D
|
D
|
D
|
D
|
D
|
D
|
D
|
D
|
D
|
D
|
D
|
D
|
D
|
D
|
D
|
D
|
D
|
D
|
D
|
| 8 |
D
|
D
|
D
|
D
|
D
|
D
|
D
|
D
|
D
|
D
|
D
|
D
|
D
|
D
|
D
|
D
|
D
|
D
|
D
|
| 9 |
D
|
D
|
D
|
D
|
D
|
D
|
D
|
D
|
D
|
D
|
D
|
D
|
D
|
D
|
D
|
D
|
D
|
D
|
D
|
| 10 |
D
|
D
|
D
|
D
|
D
|
D
|
D
|
D
|
D
|
D
|
D
|
D
|
|||||||
| 11 |
D
|
D
|
Data: The Princeton Gerrymandering Project through 2018; 270toWin research. These are general election results for the years listed. Special elections, if any, are excluded.
Vertical lines before 1992, 2002, 2012, and 2022 show Census-related redistricting breakpoints. Geographic borders associated with district numbers may have changed.
Governor Voting History
Data: Wikipedia through 2018; 270toWin research. These are general election results for the years listed. Special elections, if any, are excluded.

